|

Silver Price Analysis: XAG/USD climbs back closer to 100-day SMA support breakpoint

  • Silver stages a solid rebound from over a two-month low touched this Friday.
  • The setup warrants some caution before positioning for any further recovery.
  • A sustained move beyond the $24.00 mark could negate the bearish outlook.

Silver gains strong positive traction on Friday and snaps a four-day losing streak to the $22.70-$22.65 area, or over a two-month low touched earlier today. The white metal maintains its bid tone through the early North American session and currently trades around the $23.20-$23.25 zone, up over 2% for the day.

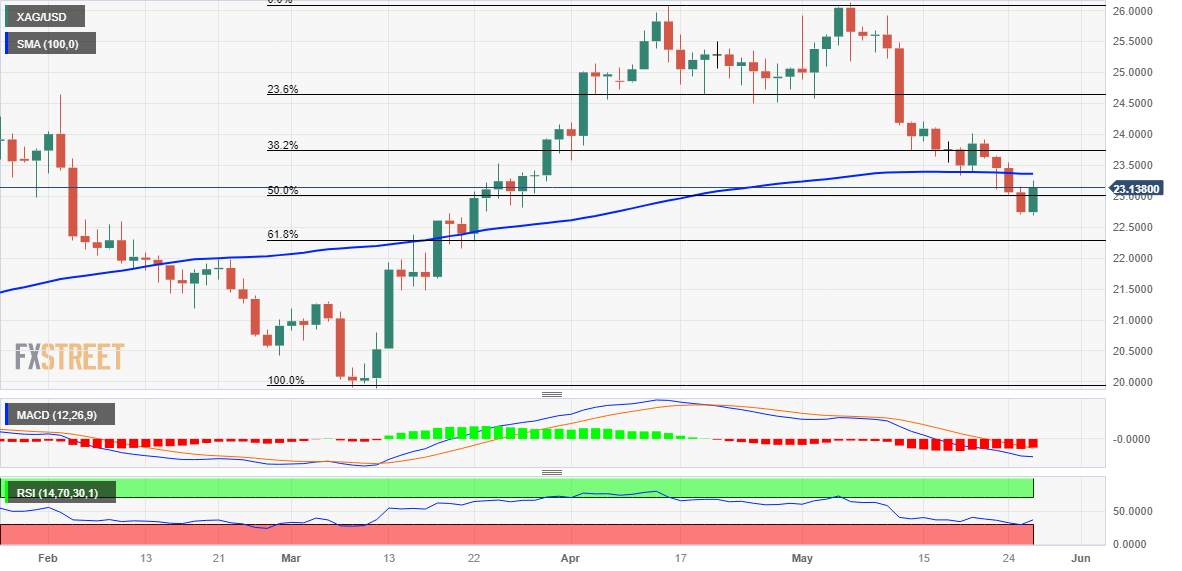
A slightly oversold Relative Strength Index (RSI) on the daily chart turns out to be a key factor that prompts aggressive short-covering around the XAG/USD. That said, this week's convincing break through the 100-day Simple Moving Average (SMA) support and the overnight slide below the 50% Fibonacci retracement level of the March-May rally favour bearish traders. This, in turn, suggests that any subsequent move up might still be seen as a selling opportunity and runs the risk of fizzling out rather quickly.

The 100-day SMA support breakpoint, currently pegged around the $23.35 region, is likely to act as an immediate hurdle. This is followed by 38.2% Fibo. level, near the $23.75 zone, above which the XAG/USD could climb to the $24.00 mark. The latter should act as a pivotal point, which if cleared decisively might trigger a fresh wave of a short-covering move and lift the commodity further beyond the $24.20-$24.25 hurdle. The recovery momentum could get extended towards the $24.50-$24.60 strong support breakpoint.

On the flip side, the monthly low, around the $22.70-$22.65 region, now seems to protect the immediate downside ahead of the 61.8% Fibo. level, near the $22.25 area. Some follow-through selling, leading to a subsequent slide below the $22.00 mark should pave the way for an extension of the recent downfall from over a one-year top touched earlier this month. The XAG/USD might then accelerate the fall towards the $21.55-$21.50 intermediate support before eventually dropping to the $21.00 round-figure mark.

Silver daily chart

fxsoriginal

Key levels to watch

XAG/USD

Overview
Today last price23.2
Today Daily Change0.46
Today Daily Change %2.02
Today daily open22.74
 
Trends
Daily SMA2024.47
Daily SMA5024.34
Daily SMA10023.36
Daily SMA20022
 
Levels
Previous Daily High23.15
Previous Daily Low22.7
Previous Weekly High24.21
Previous Weekly Low23.33
Previous Monthly High26.09
Previous Monthly Low23.57
Daily Fibonacci 38.2%22.87
Daily Fibonacci 61.8%22.98
Daily Pivot Point S122.58
Daily Pivot Point S222.42
Daily Pivot Point S322.13
Daily Pivot Point R123.03
Daily Pivot Point R223.32
Daily Pivot Point R323.48

Author

Haresh Menghani

Haresh Menghani is a detail-oriented professional with 10+ years of extensive experience in analysing the global financial markets.

More from Haresh Menghani
Share:

Markets move fast. We move first.

Orange Juice Newsletter brings you expert driven insights - not headlines. Every day on your inbox.

By subscribing you agree to our Terms and conditions.

Editor's Picks

EUR/USD moves sideways below 1.1800 on Christmas Eve

EUR/USD struggles to find direction and trades in a narrow channel below 1.1800 after posting gains for two consecutive days. Bond and stock markets in the US will open at the usual time and close early on Christmas Eve, allowing the trading action to remain subdued. 

GBP/USD keeps range around 1.3500 amid quiet markets

GBP/USD keeps its range trade intact at around 1.3500 on Wednesday. The Pound Sterling holds the upper hand over the US Dollar amid pre-Christmas light trading as traders move to the sidelines heading into the holiday season. 

Gold retreats from record highs, trades below $4,500

Gold retreats after setting a new record-high above $4,520 earlier in the day and trades in a tight range below $4,500 as trading volumes thin out ahead of the Christmas break. The US Dollar selling bias remains unabated on the back of dovish Fed expectations, which continues to act as a tailwind for the bullion amid persistent geopolitical risks.

Bitcoin slips below $87,000 as ETF outflows intensify, whale participation declines

Bitcoin price continues to trade around $86,770 on Wednesday, after failing to break above the $90,000 resistance. US-listed spot ETFs record an outflow of $188.64 million on Tuesday, marking the fourth consecutive day of withdrawals.

Economic outlook 2026-2027 in advanced countries: Solidity test

After a year marked by global economic resilience and ending on a note of optimism, 2026 looks promising and could be a year of solid economic performance. In our baseline scenario, we expect most of the supportive factors at work in 2025 to continue to play a role in 2026.

Avalanche struggles near $12 as Grayscale files updated form for ETF

Avalanche trades close to $12 by press time on Wednesday, extending the nearly 2% drop from the previous day. Grayscale filed an updated form to convert its Avalanche-focused Trust into an ETF with the US Securities and Exchange Commission.