|

Silver Price Analysis: XAG/USD bounces off 100 DMA, bears have the upper hand below 38.2% Fibo.

  • Silver attracts some buyers near the 100-day SMA support, though lacks follow-through.
  • The setup favours bearish traders and supports prospects for a further depreciating move.
  • A sustained move beyond the $23.00 mark is needed to negate the near-term bearish bias.

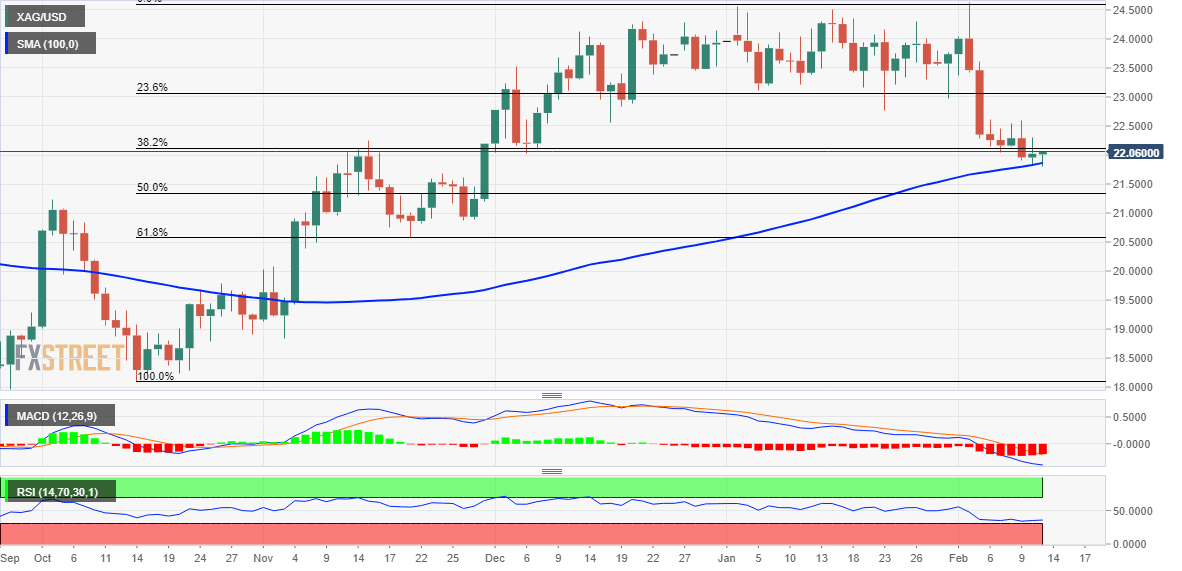
Silver manages to defend the 100-day SMA support and stage a modest bounce from its lowest level since late November, around the $21.80 region touched earlier this Monday. The white metal, however, lacks any follow-through buying and struggles to capitalize on the recovery move beyond the $22.00 mark.

From a technical perspective, last week's break and acceptance below the 38.2% Fibonacci retracement level of the recent rally from October 2022 favours bearish traders. Furthermore, oscillators on the daily chart are holding deep in the negative territory and are still far from being in the oversold zone. This, in turn, supports prospects for an extension of the recent sharp pullback from the $24.65 area, or over a nine-month high touched on February 2.

Some follow-through selling below the 100-day SMA, currently around the $21.75 region, will reaffirm the near-term bearish outlook. The XAG/USD would then turn vulnerable to test the 50% Fibo. level, around the $21.35 area. The downward trajectory could get extended further towards the $21.00 level en route to the 61.8% Fibo. level, around the $20.60-$20.55 zone. The commodity could eventually drop towards challenging the $20.00 psychological mark.

On the flip side, any meaningful recovery beyond the $22.15 area - the 38.2% Fibo. support breakpoint - is more likely to attract fresh sellers near the $22.60-$22.70 supply zone. This, in turn, should cap the XAG/USD near the $23.00 mark, representing the 23.6% Fibo. That said, a convincing break through the latter could offset the negative outlook and shift the near-term bias in favour of bullish traders, paving the way to reclaim the $24.00 round figure.

Silver daily chart

fxsoriginal

Key levels to watch

XAG/USD

Overview
Today last price22.02
Today Daily Change0.00
Today Daily Change %0.00
Today daily open22.02
 
Trends
Daily SMA2023.29
Daily SMA5023.43
Daily SMA10021.83
Daily SMA20021
 
Levels
Previous Daily High22.31
Previous Daily Low21.84
Previous Weekly High22.62
Previous Weekly Low21.84
Previous Monthly High24.55
Previous Monthly Low22.76
Daily Fibonacci 38.2%22.13
Daily Fibonacci 61.8%22.02
Daily Pivot Point S121.8
Daily Pivot Point S221.58
Daily Pivot Point S321.33
Daily Pivot Point R122.27
Daily Pivot Point R222.53
Daily Pivot Point R322.75

Author

Haresh Menghani

Haresh Menghani is a detail-oriented professional with 10+ years of extensive experience in analysing the global financial markets.

More from Haresh Menghani
Share:

Markets move fast. We move first.

Orange Juice Newsletter brings you expert driven insights - not headlines. Every day on your inbox.

By subscribing you agree to our Terms and conditions.

Editor's Picks

EUR/USD extends slide below 1.1700

The EUR/USD pair nears its weekly low at around 1.1660 in the American session on Tuesday, retreating from the 1.1750 price zone tested earlier in the day. Cautiously optimistic markets support the US Dollar in the near term.

GBP/USD consolidates around 1.3500; looks to US macro data for fresh impetus

The GBP/USD pair oscillates in a narrow range, around the 1.3500 psychological mark during the Asian session on Wednesday, and for now, seems to have stalled the previous day's retracement slide from its highest level since September 18. Moreover, the fundamental backdrop seems tilted in favor of bullish traders and suggests that the path of least resistance for spot prices is to the upside.

Gold extends upside to near $4,500 on Venezuela turmoil

Gold price climbs to near $4,500 during the early Asian trading hours on Wednesday. The precious metal rises by more than 1% in the day as geopolitical tensions and expectations of US rate cuts keep demand for gold high. The US ISM Services Purchasing Managers Index report will be published on Wednesday. 

Australia CPI likely to test RBA hawkishness

The Australian Bureau of Statistics will publish the Consumer Price Index data for November at 00:30 GMT on Wednesday. This is the second complete monthly CPI report, as the government continues to transition from the quarterly CPI to the monthly gauge as the primary measure of headline inflation.

Implications of US intervention in Venezuela

Events in Venezuela are top of mind for market participants, and while developments are associated with an elevated degree of uncertainty, we are not making any changes to our markets or economic forecasts as a result of the deposition of Nicolás Maduro. 

Cardano holds steady as bulls intensify push for breakout

Cardano rises above the 50-day EMA resistance amid a risk-on mood across the crypto market. The MACD upholds positive divergence, increasing the potential for a 20% breakout to $0.505.