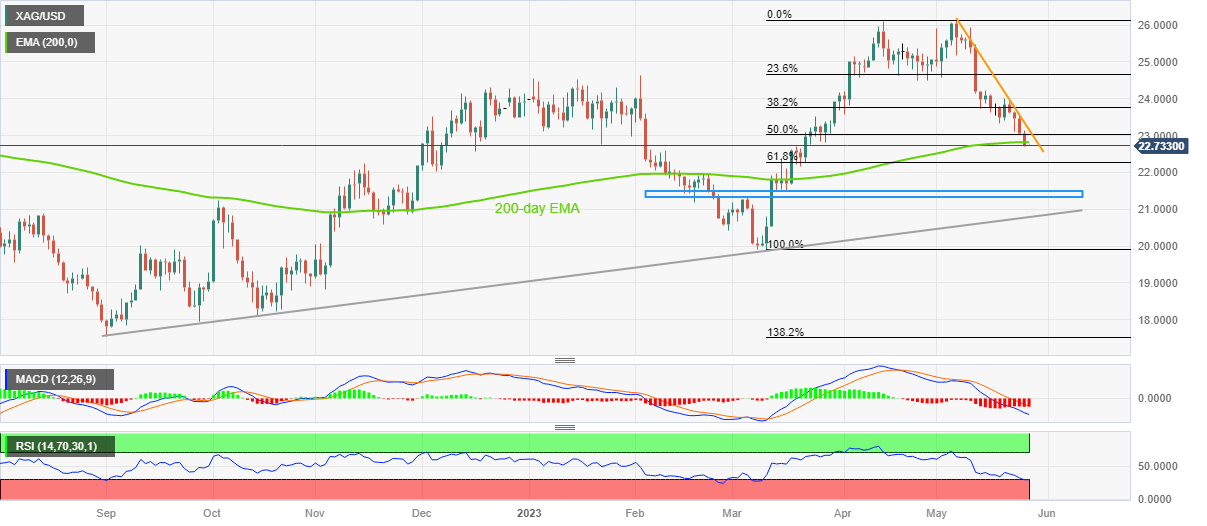
Silver Price Analysis: XAG/USD appears well set to test golden Fibonacci ration below $23.00


Share:
  • Silver Price remains pressured at two-month low after four-day losing streak.
  • Clear downside break of 200-day EMA, bearish MACD signals favor XAG/USD sellers.
  • Oversold RSI (14) prods further downside of bullion.

Silver Price (XAG/USD) stays on the back foot at around $22.75 after falling to the lowest levels since late March the previous day. That said, the precious metal declined in the last four consecutive days before licking its wounds on early Friday.

The XAG/USD’s latest fall broke the key 200-day Exponential Moving Average (EMA) support, now immediate resistance near $22.85, which in turn joins the bearish MACD signals to keep the Silver sellers hopeful. However, the oversold conditions of the RSI (14) line prod the metal’s further downside.

As a result, the quote is likely to decline towards the 61.8% Fibonacci retracement of its March-May upside around $22.30. However, the Silver Price weakness past the key Fibonacci retracement, also known as the golden Fibonacci ratio, appears difficult.

Even if the quote breaks the $22.30 Fibonacci ratio, a broad horizontal area comprising multiple levels marked since mid-February, near $21.50-30, could challenge the XAG/USD bears.

Following that, an upward-sloping support line from late 2022, around $20.80, will be in the spotlight.

On the contrary, the XAG/USD rebound past the 200-day EMA level of around $22.85 isn’t an open invitation to the Silver buyers as a convergence of the three-week-old descending trend line and 50% Fibonacci retracement, near $23.05, will check the metal’s further upside.

Silver Price: Daily chart

Trend: Limited downside expected

Additional important levels

Overview
Today last price 22.73
Today Daily Change -0.33
Today Daily Change % -1.43%
Today daily open 23.06
 
Trends
Daily SMA20 24.57
Daily SMA50 24.32
Daily SMA100 23.37
Daily SMA200 21.98
 
Levels
Previous Daily High 23.54
Previous Daily Low 23.03
Previous Weekly High 24.21
Previous Weekly Low 23.33
Previous Monthly High 26.09
Previous Monthly Low 23.57
Daily Fibonacci 38.2% 23.22
Daily Fibonacci 61.8% 23.34
Daily Pivot Point S1 22.88
Daily Pivot Point S2 22.7
Daily Pivot Point S3 22.37
Daily Pivot Point R1 23.39
Daily Pivot Point R2 23.72
Daily Pivot Point R3 23.9


Share: Feed news

Information on these pages contains forward-looking statements that involve risks and uncertainties. Markets and instruments profiled on this page are for informational purposes only and should not in any way come across as a recommendation to buy or sell in these assets. You should do your own thorough research before making any investment decisions. FXStreet does not in any way guarantee that this information is free from mistakes, errors, or material misstatements. It also does not guarantee that this information is of a timely nature. Investing in Open Markets involves a great deal of risk, including the loss of all or a portion of your investment, as well as emotional distress. All risks, losses and costs associated with investing, including total loss of principal, are your responsibility. The views and opinions expressed in this article are those of the authors and do not necessarily reflect the official policy or position of FXStreet nor its advertisers. The author will not be held responsible for information that is found at the end of links posted on this page.

If not otherwise explicitly mentioned in the body of the article, at the time of writing, the author has no position in any stock mentioned in this article and no business relationship with any company mentioned. The author has not received compensation for writing this article, other than from FXStreet.

FXStreet and the author do not provide personalized recommendations. The author makes no representations as to the accuracy, completeness, or suitability of this information. FXStreet and the author will not be liable for any errors, omissions or any losses, injuries or damages arising from this information and its display or use. Errors and omissions excepted.

The author and FXStreet are not registered investment advisors and nothing in this article is intended to be investment advice.

Follow us on Telegram

Stay updated of all the news

Join Telegram

Recommended content


Follow us on Telegram

Stay updated of all the news

Join Telegram

Recommended content

Editors’ Picks

EUR/USD clings to small daily gains above 1.0700

EUR/USD clings to small daily gains above 1.0700

EUR/USD has lost its traction after having climbed toward 1.0750 earlier in the day but managed to stabilize above 1.0700. Mixed performance of Wall Street's main indexes following the consumer confidence data helps the US Dollar hold its ground and caps the pair's upside.

EUR/USD News

GBP/USD retreats below 1.2400 as US Dollar rebounds

GBP/USD retreats below 1.2400 as US Dollar rebounds

GBP/USD has retraced a small portion of its daily rally and declined below 1.2400 in the American session on Tuesday. Following a bullish start to the day, major equity indexes lost traction and helped the US Dollar stage a rebound while weighing on the pair.

GBP/USD News

Gold: XAU/USD retakes $1,950 as investors hesitate Premium

Gold: XAU/USD retakes $1,950 as investors hesitate

Gold price has posted a nice comeback after bottoming for the day at $1,932 a troy ounce, now trading near a daily high of $1,963.48.

Gold News

Bitcoin whales could prevent BTC price first monthly loss of 2023 through this move

Bitcoin whales could prevent BTC price first monthly loss of 2023 through this move

Bitcoin price is inching towards the first monthly loss of 2023. At press time, BTC price is 4.4% below $29,233, its price on May 1. If BTC fails to regain lost ground, the asset is in for its first monthly loss of the year.

Read more

Tesla Stock News: TSLA breaks above $200 as Elon Musk visits China

Tesla Stock News: TSLA breaks above $200 as Elon Musk visits China

Tesla (TSLA) stock has overcome a major psychological barrier to start the week with shares overcoming the $200 level early Tuesday. A number of tailwinds are aiding the growth stock, which has gained 4.4% to $201.67 in the premarket.

Read more

Forex MAJORS

Cryptocurrencies

Signatures