- Silver is recovering within a falling channel.
- It has met tough resistance at the level of the 50 and 100-period SMAs on the 4-hour chart.
- There are bullish signs but a breakout of the channel would be a prerequisite for a more confident stance.
Silver (XAG/USD) continues recovering within a descending channel. The precious metal found support at the June 26 and 13 lows (around 26.88). Its first attempt to break above the cluster of Moving Averages in the mid $29.40s failed but after its pullback on July 1 it has started creeping higher again.
Silver 4-hour Chart
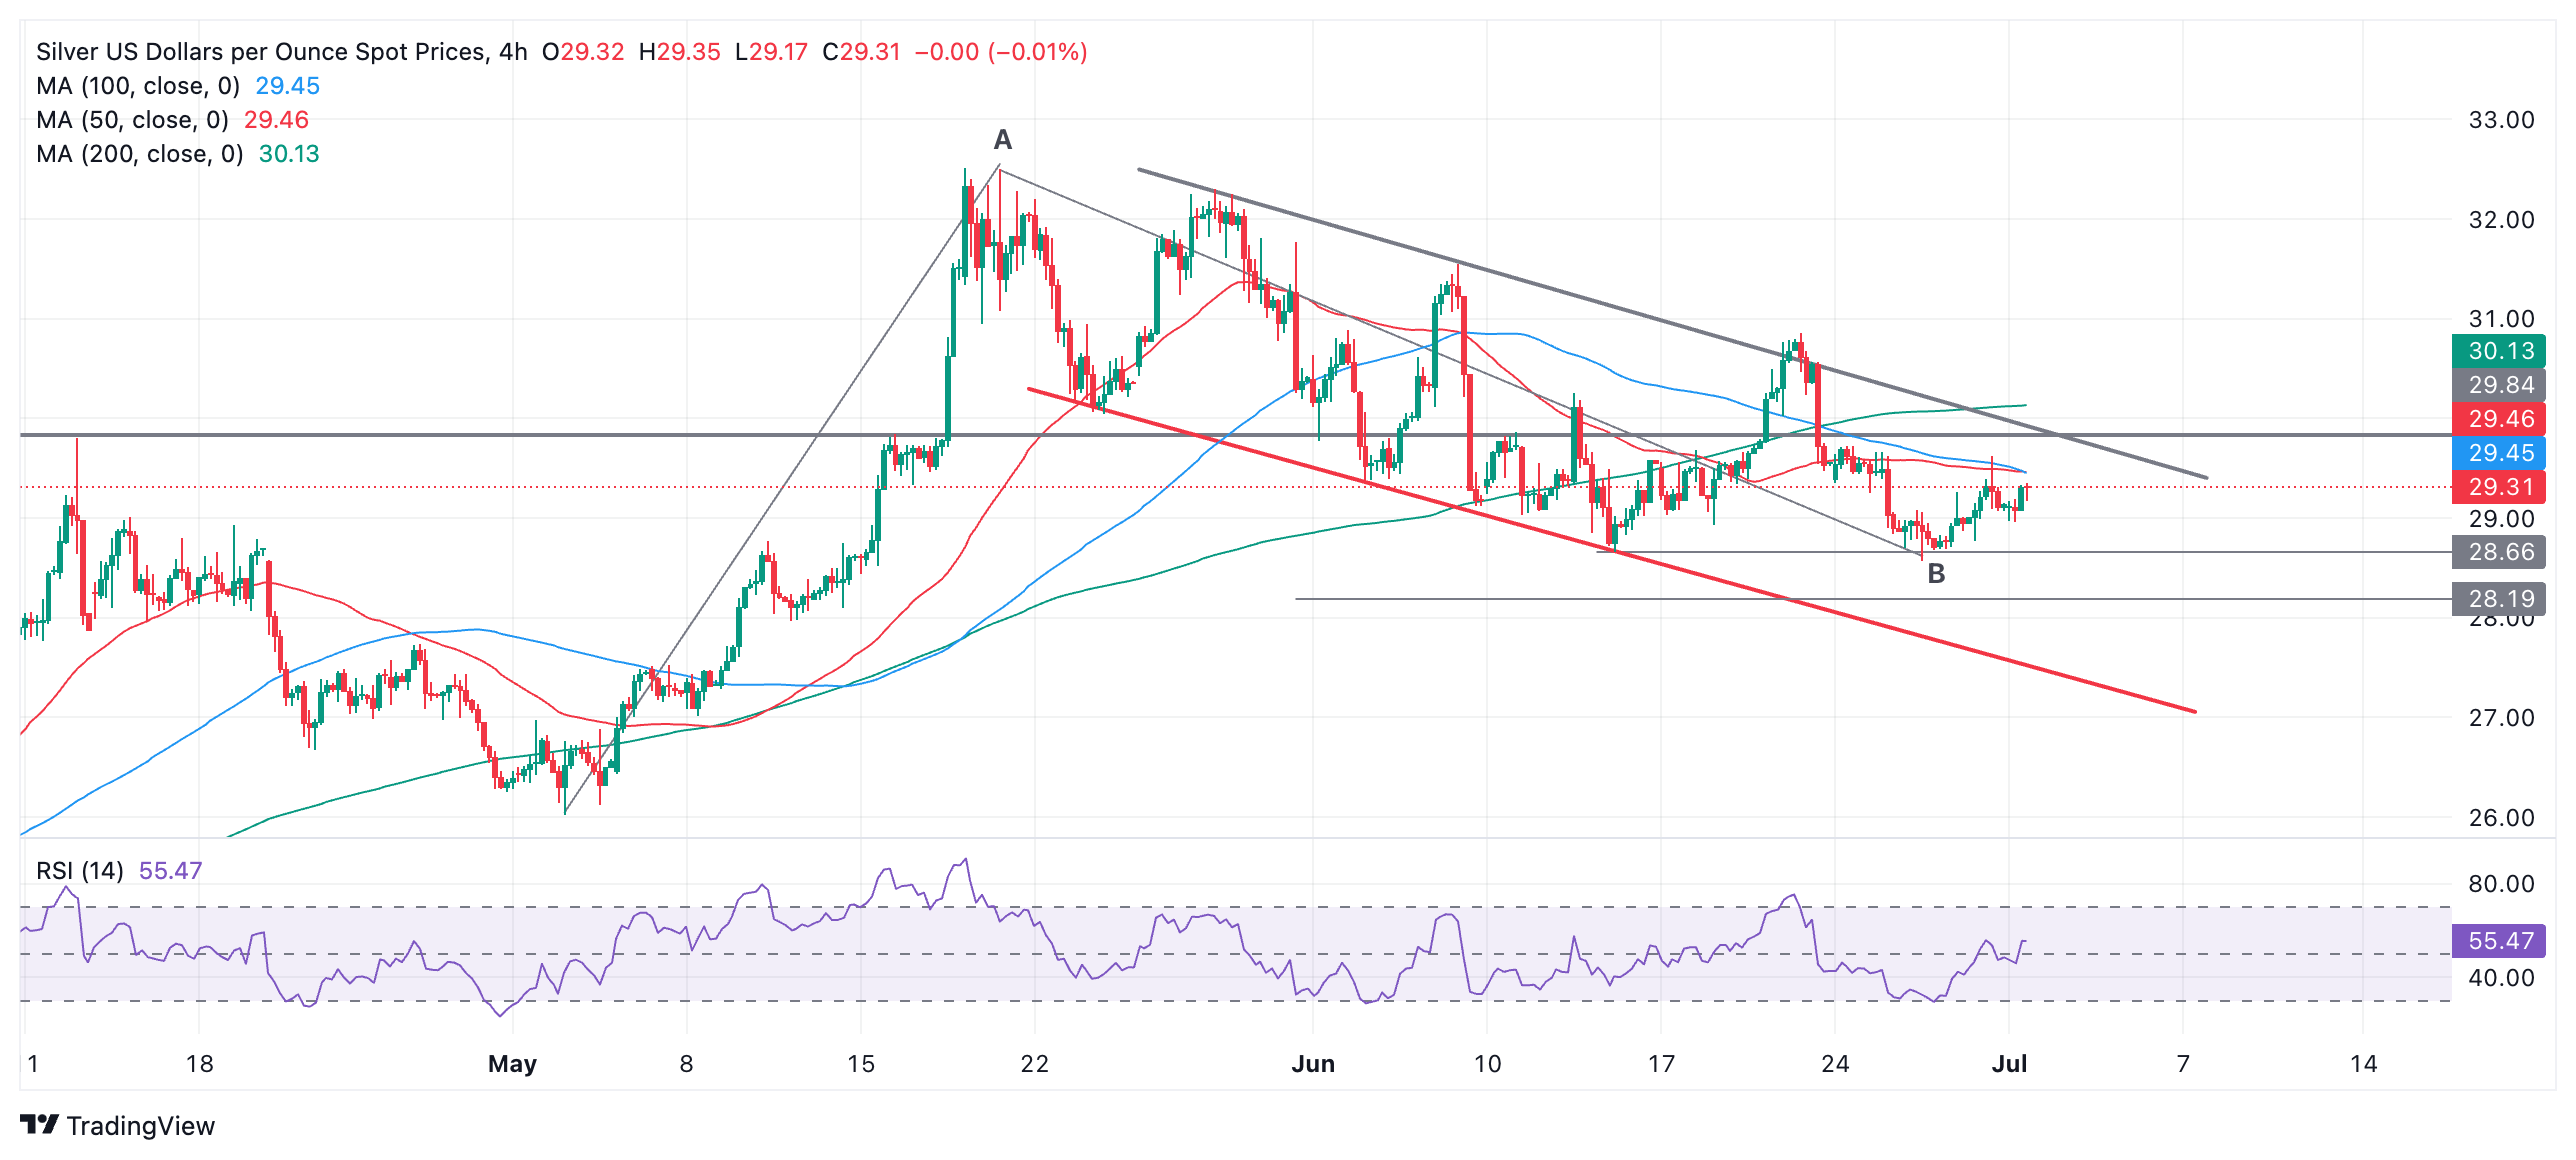
It is now debatable whether Silver is still in a bearish short-term trend, which means there is no longer a downside bias. However, it is in a falling channel which does add a bearish tone to the charts.
Therefore, if price falls back below $28.57, the June 26 low, it would reconfirm the downside bias, with the next target lying at the lower channel line, at around $27.50.
If Silver continues recovering and breaks on a closing basis above the 50 and 100 SMAs, however, it would indicate a continuation higher to the upper channel line at around $29.90. This would be a critical crossroads for the pair. It is also a major resistance level at the top of a four-year consolidation zone. A decisive break above would indicate the start of a new short-term uptrend.
A decisive break would be one accompanied by a long green up candle that broke clearly above the level and closed near its high or three green candles in a row that broke above the level.
Silver temporarily broke out of the top of the falling channel on June 20, and although it quickly fell back, the fact it breached the integrity of the channel, albeit temporarily, indicates the upper channel line has been weakened and is more likely to give way again. This also adds a slightly bullish note to the charts.
The rally during the start of May also gives the chart a further bullish aspect. One view could suggest this rally was a wave “A” and the whole of the falling channel is the second large wave, or wave “B”, of a Measured Move (MM) pattern higher. MMs are three-wave zig-zags. If so, this could indicate a move of a similar length could unfold to the upside, in a wave “C”. Such a move, if it materializes – and it’s too early to say yet – would probably take Silver up to around the $33.00 mark.
Information on these pages contains forward-looking statements that involve risks and uncertainties. Markets and instruments profiled on this page are for informational purposes only and should not in any way come across as a recommendation to buy or sell in these assets. You should do your own thorough research before making any investment decisions. FXStreet does not in any way guarantee that this information is free from mistakes, errors, or material misstatements. It also does not guarantee that this information is of a timely nature. Investing in Open Markets involves a great deal of risk, including the loss of all or a portion of your investment, as well as emotional distress. All risks, losses and costs associated with investing, including total loss of principal, are your responsibility. The views and opinions expressed in this article are those of the authors and do not necessarily reflect the official policy or position of FXStreet nor its advertisers. The author will not be held responsible for information that is found at the end of links posted on this page.
If not otherwise explicitly mentioned in the body of the article, at the time of writing, the author has no position in any stock mentioned in this article and no business relationship with any company mentioned. The author has not received compensation for writing this article, other than from FXStreet.
FXStreet and the author do not provide personalized recommendations. The author makes no representations as to the accuracy, completeness, or suitability of this information. FXStreet and the author will not be liable for any errors, omissions or any losses, injuries or damages arising from this information and its display or use. Errors and omissions excepted.
The author and FXStreet are not registered investment advisors and nothing in this article is intended to be investment advice.
Recommended content
Editors’ Picks

EUR/USD accelerates losses to 1.0930 on stronger Dollar
The US Dollar's recovery regains extra impulse sending the US Dollar Index to fresh highs and relegating EUR/USD to navigate the area of daily troughs around 1.0930 in the latter part of Friday's session.

GBP/USD plummets to four-week lows near 1.2850
The US Dollar's rebound keep gathering steam and now sends GBP/USD to the area of multi-week lows in the 1.2850 region amid the broad-based pullback in the risk-associated universe.

Gold trades on the back foot, flirts with $3,000
Gold prices are accelerating their daily decline, steadily approaching the critical $3,000 per troy ounce mark as the Greenback's rebound gains extra momentum and US yields tighten their retracement.

Can Maker break $1,450 hurdle as whales launch buying spree?
Maker holds steadily above $1,250 support as a whale scoops $1.21 million worth of MKR. Addresses with a 100k to 1 million MKR balance now account for 24.27% of Maker’s total supply. Maker battles a bear flag pattern as bulls gather for an epic weekend move.

Strategic implications of “Liberation Day”
Liberation Day in the United States came with extremely protectionist and inward-looking tariff policy aimed at just about all U.S. trading partners. In this report, we outline some of the more strategic implications of Liberation Day and developments we will be paying close attention to going forward.

The Best brokers to trade EUR/USD
SPONSORED Discover the top brokers for trading EUR/USD in 2025. Our list features brokers with competitive spreads, fast execution, and powerful platforms. Whether you're a beginner or an expert, find the right partner to navigate the dynamic Forex market.