|

Silver Price Analysis: Rising wedge near multi-day high teases XAG/USD bears, $22.70 eyed

  • Silver prices retreats from seven-week high, portrays a bearish chart formation.
  • Overbought RSI, sluggish MACD signals add strength to downside bias.
  • Key SMAs can test the XAG/USD sellers; bulls need validation from $23.60.

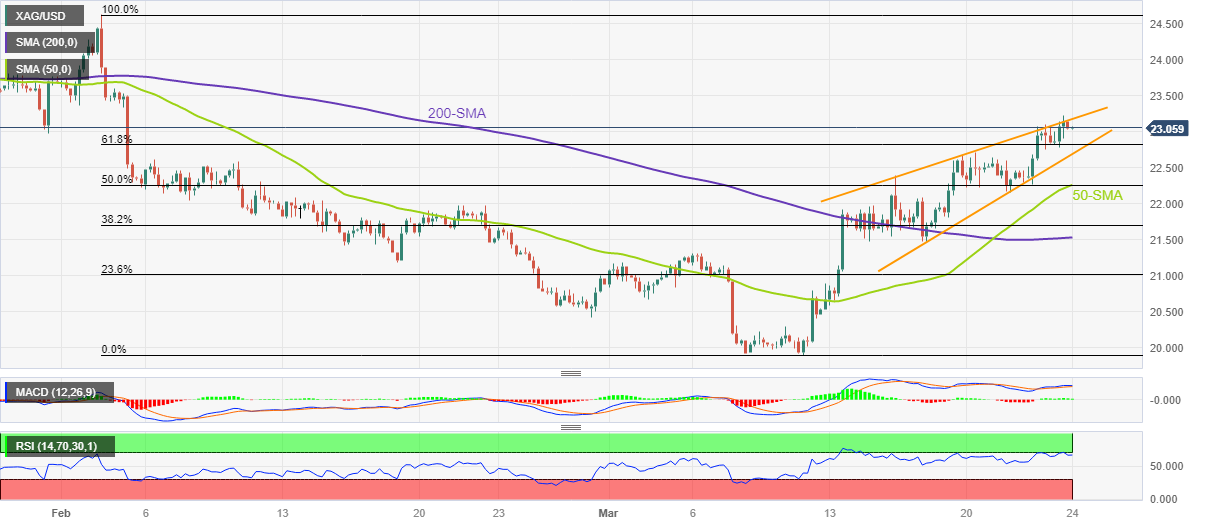
Silver price (XAG/USD) drops to $23.00 as it snaps a two-day winning streak while reversing from the highest levels since early February on Friday. In doing so, the bright metal prints a one-week-old rising wedge bearish chart formation and lures the sellers due to the pattern’s positioning at the multi-day top.

Adding strength to the downside bias could be the sluggish MACD signals and the overbought conditions of the RSI (14) line.

As a result, the XAG/USD is likely to decline further toward the 61.8% Fibonacci retracement level of the metal’s fall during the February-March period, around $22.80.

However, the quote’s further declines hinge on its ability to break the stated wedge’s lower line, around $22.60 at the latest.

Following that, the 50-SMA and 200-SMA can entertain the XAG/USD sellers around $22.30 and $21.55 during the theoretical south-run towards the early March swing high surrounding $21.30.

Alternatively, recovery moves need to cross the $23.20 hurdle to defy the bearish chart formation.

Even so, multiple hurdles marked around $23.60 can prod the Silver buyers before directing them to the previous monthly high surrounding $24.65.

Overall, Silver price is likely to witness a pullback but the road towards the south appears limited.

Silver: Four-hour chart

Trend: Further downside expected

Additional important levels

Overview
Today last price23.05
Today Daily Change0.08
Today Daily Change %0.35%
Today daily open22.97
 
Trends
Daily SMA2021.3
Daily SMA5022.28
Daily SMA10022.42
Daily SMA20020.96
 
Levels
Previous Daily High23.07
Previous Daily Low22.27
Previous Weekly High22.61
Previous Weekly Low20.54
Previous Monthly High24.64
Previous Monthly Low20.42
Daily Fibonacci 38.2%22.77
Daily Fibonacci 61.8%22.58
Daily Pivot Point S122.47
Daily Pivot Point S221.97
Daily Pivot Point S321.67
Daily Pivot Point R123.27
Daily Pivot Point R223.57
Daily Pivot Point R324.07

Author

Anil Panchal

Anil Panchal

FXStreet

Anil Panchal has nearly 15 years of experience in tracking financial markets. With a keen interest in macroeconomics, Anil aptly tracks global news/updates and stays well-informed about the global financial moves and their implications.

More from Anil Panchal
Share:

Markets move fast. We move first.

Orange Juice Newsletter brings you expert driven insights - not headlines. Every day on your inbox.

By subscribing you agree to our Terms and conditions.

Editor's Picks

EUR/USD bounces toward 1.1750 as US Dollar loses strength

EUR/USD returned to the 1.1750 price zone in the American session on Friday, despite falling Wall Street, which indicates risk aversion. Trading conditions remain thin following the New Year holiday and ahead of the weekend, with the focus shifting to US employment and European data scheduled for next week.

GBP/USD nears 1.3500, holds within familiar levels

After testing 1.3400 on the last day of 2025, GBP/USD managed to stage a rebound. Nevertheless, the pair finds it difficult to gather momentum and trades with modest intraday gains at around 1.3490 as market participants remain in holiday mood.

Gold trims intraday gains, approaches $4,300

Gold retreated sharply from the $4,400  area and trades flat for the day in the $4,320 price zone. Choppy trading conditions exacerbated the intraday decline, although XAU/USD bearish case is out of the picture, considering growing expectations for a dovish Fed and persistent geopolitical tensions.

Cardano gains early New Year momentum, bulls target falling wedge breakout

Cardano kicks off the New Year on a positive note and is extending gains, trading above $0.36 at the time of writing on Friday. Improving on-chain and derivatives data point to growing bullish interest, while the technical outlook keeps an upside breakout in focus.

Economic outlook 2026-2027 in advanced countries: Solidity test

After a year marked by global economic resilience and ending on a note of optimism, 2026 looks promising and could be a year of solid economic performance. In our baseline scenario, we expect most of the supportive factors at work in 2025 to continue to play a role in 2026.

Crypto market outlook for 2026

Year 2025 was volatile, as crypto often is.  Among positive catalysts were favourable regulatory changes in the U.S., rise of Digital Asset Treasuries (DAT), adoption of AI and tokenization of Real-World-Assets (RWA).