|

Silver Price Analysis: Rising wedge favours XAG/USD bears, break below 200-HMA awaited

  • Silver has been oscillating between two converging trend-lines, forming a bearish wedge.
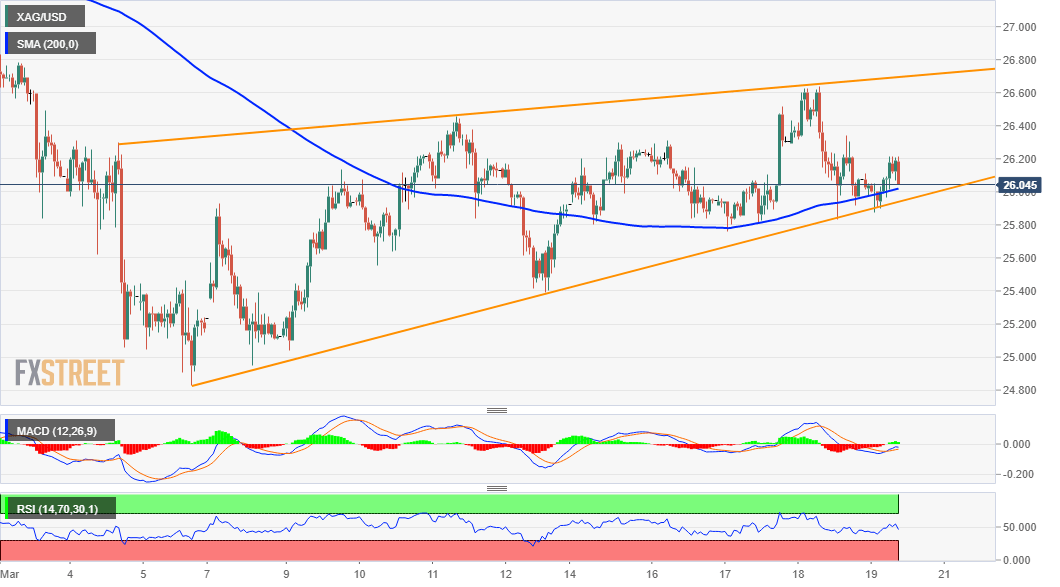
  • The pattern support coincides with 200-hour SMA and should act as a key pivotal point.

Silver edged lower on the last trading day of the week and was last seen hovering near daily lows, around the $26.00 mark. That said, the commodity, so far, has managed to hold its neck above 200-hour SMA support, though the near-term bias seems tilted in favour of bearish traders.

The recent price moves have been confined between two upward sloping converging trend-lines. This constitutes the formation of a bearish rising wedge chart pattern and supports prospects for further weakness. The pattern support, currently around the $26.00-$25.90 region coincides with 200-hour SMA and should act as a pivotal point. A convincing break below will mark a fresh bearish breakdown and prompt some aggressive selling.

The XAG/USD might then accelerate the slide further towards intermediate support near the $25.40-35 zone en-route the key $25.00 psychological mark. This is followed by monthly swing lows, around the $24.85 region. Some follow-through selling should pave the way for an extension of the recent sharp pullback from the $30.00 level and drag the XAG/USD towards the very important 200-day SMA, currently near the $24.00 round-figure mark.

On the flip side, any meaningful positive move might still be seen as a selling opportunity and confront stiff resistance near the $26.50-60 region. The mentioned barrier coincides with the top end of the wedge pattern, which if cleared decisively will negate the bearish bias. The subsequent short-covering move has the potential to lift the XAG/USD back beyond the $27.00 mark, towards the next relevant hurdle near the $27.30 supply zone.

XAG/USD 1-hourly chart

fxsoriginal

Technical levels to watch

XAG/USD

Overview
Today last price26.08
Today Daily Change0.00
Today Daily Change %0.00
Today daily open26.08
 
Trends
Daily SMA2026.43
Daily SMA5026.34
Daily SMA10025.59
Daily SMA20024.52
 
Levels
Previous Daily High26.64
Previous Daily Low25.83
Previous Weekly High26.46
Previous Weekly Low24.95
Previous Monthly High30.07
Previous Monthly Low25.9
Daily Fibonacci 38.2%26.14
Daily Fibonacci 61.8%26.33
Daily Pivot Point S125.72
Daily Pivot Point S225.38
Daily Pivot Point S324.92
Daily Pivot Point R126.53
Daily Pivot Point R226.99
Daily Pivot Point R327.34

Author

Haresh Menghani

Haresh Menghani is a detail-oriented professional with 10+ years of extensive experience in analysing the global financial markets.

More from Haresh Menghani
Share:

Markets move fast. We move first.

Orange Juice Newsletter brings you expert driven insights - not headlines. Every day on your inbox.

By subscribing you agree to our Terms and conditions.

Editor's Picks

EUR/USD moves sideways below 1.1800 on Christmas Eve

EUR/USD struggles to find direction and trades in a narrow channel below 1.1800 after posting gains for two consecutive days. Bond and stock markets in the US will open at the usual time and close early on Christmas Eve, allowing the trading action to remain subdued. 

GBP/USD keeps range around 1.3500 amid quiet markets

GBP/USD keeps its range trade intact at around 1.3500 on Wednesday. The Pound Sterling holds the upper hand over the US Dollar amid pre-Christmas light trading as traders move to the sidelines heading into the holiday season. 

Gold retreats from record highs, trades below $4,500

Gold retreats after setting a new record-high above $4,520 earlier in the day and trades in a tight range below $4,500 as trading volumes thin out ahead of the Christmas break. The US Dollar selling bias remains unabated on the back of dovish Fed expectations, which continues to act as a tailwind for the bullion amid persistent geopolitical risks.

Bitcoin slips below $87,000 as ETF outflows intensify, whale participation declines

Bitcoin price continues to trade around $86,770 on Wednesday, after failing to break above the $90,000 resistance. US-listed spot ETFs record an outflow of $188.64 million on Tuesday, marking the fourth consecutive day of withdrawals.

Economic outlook 2026-2027 in advanced countries: Solidity test

After a year marked by global economic resilience and ending on a note of optimism, 2026 looks promising and could be a year of solid economic performance. In our baseline scenario, we expect most of the supportive factors at work in 2025 to continue to play a role in 2026.

Avalanche struggles near $12 as Grayscale files updated form for ETF

Avalanche trades close to $12 by press time on Wednesday, extending the nearly 2% drop from the previous day. Grayscale filed an updated form to convert its Avalanche-focused Trust into an ETF with the US Securities and Exchange Commission.