|

Silver Price Analysis: Acceptance below $23.00/61.8% Fibo. favours XAG/USD bears

  • Silver was seen consolidating recent losses to the lowest level since October 13.
  • The set-up favours bearish trades and supports prospects for additional losses.
  • Any recovery attempt could be seen as a selling opportunity and remain capped.

Silver lacked firm directional bias on Tuesday and seesawed between tepid gains/minor losses heading into the North American session. The white metal was last seen trading around the $22.85-80 region, just above the lowest level since October 13 touched in the previous day.

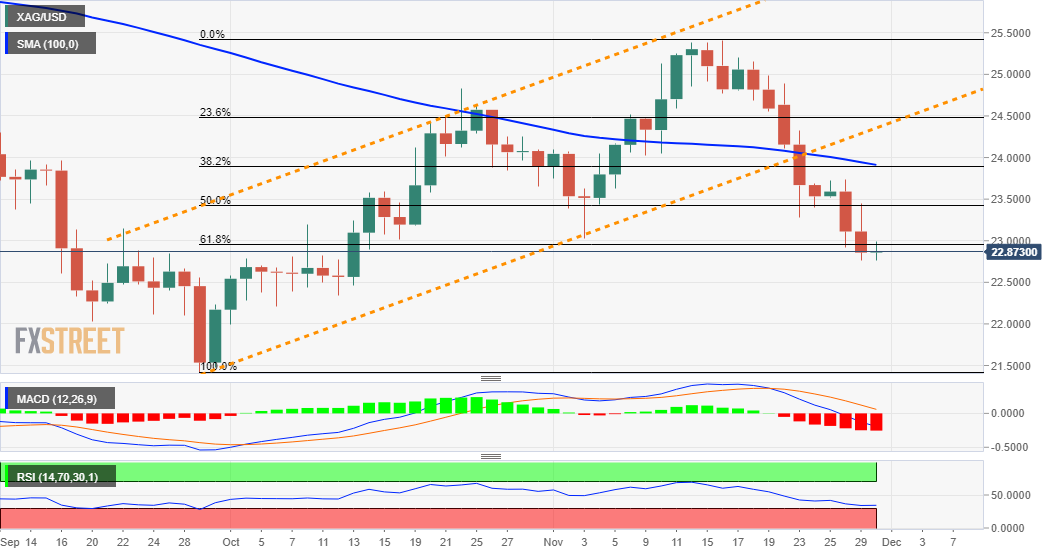
Looking at the technical picture, the XAG/USD now seems to have found acceptance below the $23.00 round-figure and the 61.8% Fibonacci level of the $21.42-$25.41 strong move up. This comes on the back of the recent break through the 100-day SMA and an ascending channel confluence support, which, in turn, favours bearish traders.

The negative outlook is reinforced by the fact that technical indicators on the daily chart are holding deep in the negative territory and are still far from being in the oversold zone. Some follow-through selling below the $22.70-65 region will reaffirm the bearish bias and pave the way for a further near-term depreciating move.

The XAG/USD might then accelerate the slide towards testing the next relevant support near the $22.30-25 region before eventually dropping to the $22.00 round-figure mark. The downward trajectory could further get extended towards the YTD low, around the $21.45-40 region set on September 29.

On the flip side, any attempted recovery now seems to confront stiff resistance near the $23.00-10 region. A further move up would now be seen as a selling opportunity and runs the risk of fizzling out quickly near the $23.40-45 region. The latter coincides with the 50% Fibo. level, which should cap the upside for the XAG/USD, at least for now.

Silver daily chart

fxsoriginal

Technical levels to watch

XAG/USD

Overview
Today last price22.84
Today Daily Change-0.02
Today Daily Change %-0.09
Today daily open22.86
 
Trends
Daily SMA2024.22
Daily SMA5023.57
Daily SMA10023.94
Daily SMA20025.2
 
Levels
Previous Daily High23.44
Previous Daily Low22.76
Previous Weekly High24.89
Previous Weekly Low22.92
Previous Monthly High24.83
Previous Monthly Low22
Daily Fibonacci 38.2%23.02
Daily Fibonacci 61.8%23.18
Daily Pivot Point S122.6
Daily Pivot Point S222.33
Daily Pivot Point S321.91
Daily Pivot Point R123.28
Daily Pivot Point R223.7
Daily Pivot Point R323.97

Author

Haresh Menghani

Haresh Menghani is a detail-oriented professional with 10+ years of extensive experience in analysing the global financial markets.

More from Haresh Menghani
Share:

Editor's Picks

AUD/USD eyes 0.7150 barrier nine-day EMA

AUD/USD inches higher after registering modest losses in the previous day, trading around 0.7130 during the Asian hours. The technical analysis of the daily chart indicates that the pair is moving sideways within the rectangle pattern, suggesting a consolidation as neither the bulls nor the bears have enough momentum to take control of the market.

USD/JPY trades below 160.00 intervention threshold; bullish bias intact

The USD/JPY pair attracts some sellers during the Asian session amid fears that authorities will step in again to prop up the Japanese Yen. Furthermore, the Israel-Lebanon truce prompts some profit-taking around the US Dollar and exerts downward pressure on the currency pair.

Gold defends 200-day SMA, rises toward $4,500

Gold is attempting a tepid recovery toward $4,500 on Thursday, as renewed optimism in the Mideast geopolitical front calms market nerves. This cautious optimism across Asian markets weighs on Oil prices, and diminishes the US Dollar’s safe-haven appeal, helping Gold stage a decent comeback from the weekly low of $4,424.


Hyperliquid: ETF demand, capital rotation fuel HYPE rally as Bitcoin melts

Hyperliquid price sustains an upward trend near its all-time high of $75.76 on Thursday after posting 80% gains in May, while Bitcoin (BTC) retraces below $65,000, triggering a market-wide panic.

Kevin Warsh takes the Fed helm: What it means for the US Dollar
The Federal Reserve moves away from the highly predictable "forward guidance" model of the Jerome Powell era to a new “Kevin Warsh environment”, characterized by less communication, more policy surprises, and an increased focus on the Fed's complex balance sheet.
Recession on paper: What really moves the Canadian Loonie now?

Statistics Canada handed the headline writers a gift and the analysts a headache. Real GDP shrank 0.1% on an annualized basis in the first quarter, and with the fourth quarter of 2025 revised down to a 1.0% contraction, that is two negative quarters in a row, the textbook definition of a technical recession and Canada's first since the pandemic.