Silver is still range-bound despite bullish fundamentals


  • Silver has been trapped in a range within a range since 2020. 
  • Bullish fundamentals suggest more upside for Silver but charts are ambiguous. 
  • A decisive break above $26.00 would provide confirmation of a bullish turn. 

Silver (XAG/USD) price is trading in a range within an even wider range that dates back to 2020. Whilst the precious metal’s fundamentals look bright for 2024, Silver price is still very much in a straight jacket from a technical perspective. 


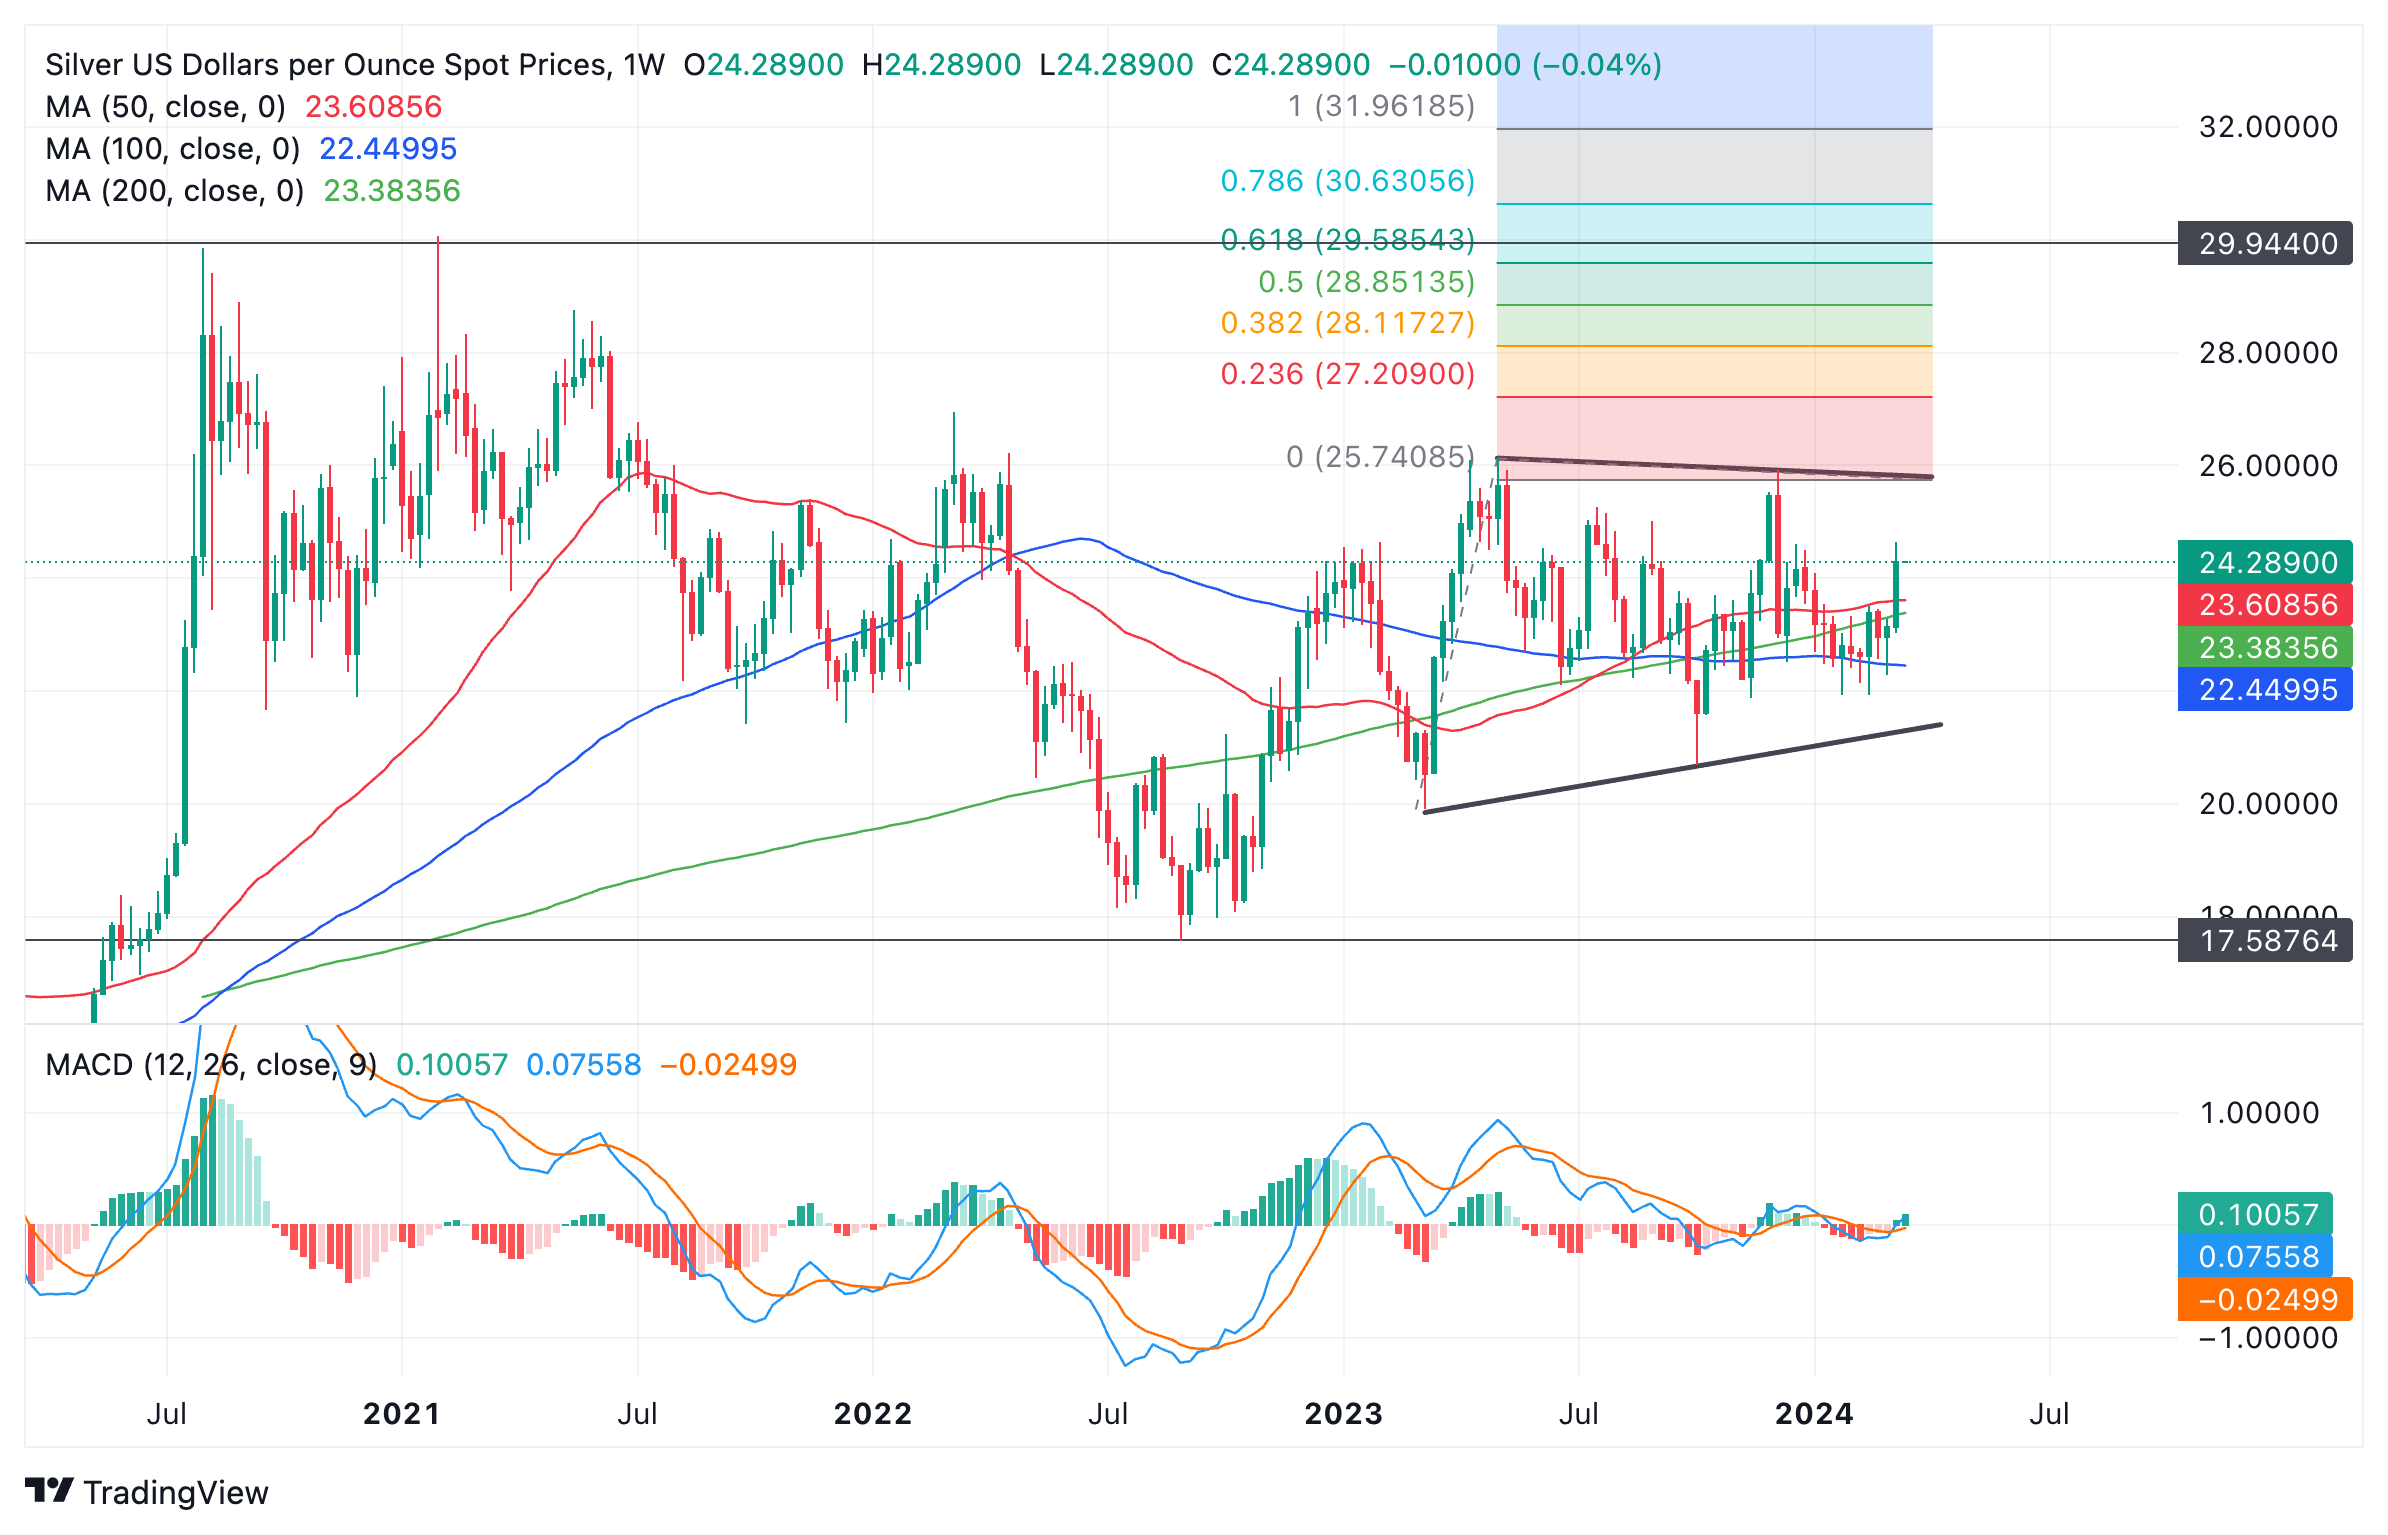
Silver versus US Dollar: Weekly chart

The broader range starts from the 2020 highs at close to $30.00 an ounce, and the 2022 lows at around $17.50. Within that, Silver has more recently been oscillating within another narrower range caught between roughly $26.00 and $20.00 (thick black lines). 

Silver’s bullish fundamentals are based on its dual role as both an industrial metal and a store of value. 

As an industrial metal Silver is likely to see increased demand from improved global growth prospects. As a store of value, Silver is likely to see increased demand due to inflation and interest rates falling. 

The Silver Institute, a not-for-profit association, forecasts global Silver demand reaching 1.2 billion ounces in 2024, hitting its second-highest level on record.

Silver Price: Technical missrepresentation 

Silver’s technicals do not closely mirror its long-term bullish fundamentals – for them to do so, Silver price would have to break out of the ranges it is currently stuck in. 

To begin with it will need to break out of the smaller range. Assuming a breakout above the top of the range at $26.00, XAG/USD will likely rise as far as the height of the range extended from the breakout point higher, or a Fibonacci ratio of the height. 

This could see Silver rally to just shy of $32.00, or the $29.50s if using the 0.618 Fibonacci ratio of the range. 

In order to avoid being caught in a false break investors should make sure the break above $26.00 is decisive. This means it should be accompanied by a longer-than-average daily bullish candlestick which closes near its high, or three up days that pierce cleanly above the resistance level. 

The same would be true of the breakout of the wider range. 

If the technical picture turns bearish, however, a decisive break below the $20.00 level would be expected lead to a sharp move down to the wider range lows at $16.00 and possibly lower.


Share: Feed news

Information on these pages contains forward-looking statements that involve risks and uncertainties. Markets and instruments profiled on this page are for informational purposes only and should not in any way come across as a recommendation to buy or sell in these assets. You should do your own thorough research before making any investment decisions. FXStreet does not in any way guarantee that this information is free from mistakes, errors, or material misstatements. It also does not guarantee that this information is of a timely nature. Investing in Open Markets involves a great deal of risk, including the loss of all or a portion of your investment, as well as emotional distress. All risks, losses and costs associated with investing, including total loss of principal, are your responsibility. The views and opinions expressed in this article are those of the authors and do not necessarily reflect the official policy or position of FXStreet nor its advertisers. The author will not be held responsible for information that is found at the end of links posted on this page.

If not otherwise explicitly mentioned in the body of the article, at the time of writing, the author has no position in any stock mentioned in this article and no business relationship with any company mentioned. The author has not received compensation for writing this article, other than from FXStreet.

FXStreet and the author do not provide personalized recommendations. The author makes no representations as to the accuracy, completeness, or suitability of this information. FXStreet and the author will not be liable for any errors, omissions or any losses, injuries or damages arising from this information and its display or use. Errors and omissions excepted.

The author and FXStreet are not registered investment advisors and nothing in this article is intended to be investment advice.

Recommended content


Recommended content

Editors’ Picks

EUR/USD climbs above 1.1650 area on improving risk mood

EUR/USD climbs above 1.1650 area on improving risk mood

EUR/USD extends its daily rally and trades above 1.1650 in the American session on Friday. The sharp decline seen in the 1-year Consumer Inflation Expectations component of the UoM Consumer Sentiment Index weighs on the US Dollar and helps the pair push higher.

GBP/USD rises above 1.3450 on USD weakness

GBP/USD rises above 1.3450 on USD weakness

GBP/USD gathers bullish momentum and trades above 1.3450 on Friday after struggling to find direction on Thursday. The positive shift seen in market mood and the pullback seen in US consumer inflation expectations hurt the US Dollar and support the pair heading into the weekend.

Gold extends daily recovery beyond $3,350

Gold extends daily recovery beyond $3,350

Gold gains traction on Friday and clings to daily gains above $3,350. Renewed US Dollar (USD) weakness and retreating US Treasury bond yields allow XAU/USD to edge higher, while the upbeat market mood limits the pair's upside.

Bitcoin nears all-time high, Ethereum eyes $4,000, Ripple sets new record

Bitcoin nears all-time high, Ethereum eyes $4,000, Ripple sets new record

Bitcoin price is trading above $120,000 on Friday, inching closer to its all-time high of $123,218. Ethereum price has surged by over 20% so far this week, with bulls aiming for the $4,000 level next. Ripple has taken center stage, reaching a new record high of $3.66 on Friday, signaling renewed demand and optimism across the market.

China’s first-half growth remains on track, though activity data signals caution

China’s first-half growth remains on track, though activity data signals caution

China's second-quarter GDP beat forecasts again with a 5.2% year-on-year growth, driven by strong trade and industrial production. Yet sharper-than-expected slowdowns in fixed-asset investment and retail sales and falling property prices are a concern.

Best Brokers for EUR/USD Trading

Best Brokers for EUR/USD Trading

SPONSORED Discover the top brokers for trading EUR/USD in 2025. Our list features brokers with competitive spreads, fast execution, and powerful platforms. Whether you're a beginner or an expert, find the right partner to navigate the dynamic Forex market.

Forex MAJORS

Cryptocurrencies

Signatures

Best Brokers of 2025