Pound Sterling Price News and Forecast: GBP/USD bulls continue to ignore overbought conditions [Video]
![Pound Sterling Price News and Forecast: GBP/USD bulls continue to ignore overbought conditions [Video]](https://editorial.fxstreet.com/images/Markets/Currencies/Majors/GBPUSD/iStock-170160529.jpg)
GBP/USD Forecast: Bulls continue to ignore overbought conditions
Following Monday's short-lasting downward correction, GBP/USD regained its traction early Tuesday and was last seen trading at its highest level since March 2022 near 1.3230.
The positive shift seen in risk sentiment on easing fears over a deepening conflict in the Middle East doesn't allow the US Dollar (USD) to build on Monday's rebound and allows GBP/USD to stretch higher in the European morning. At the time of press, the UK's FTSE 100 Index was up 0.6% on the day and US stock index futures were rising between 0.1% and 0.25%, reflecting the improving market mood. Read more...
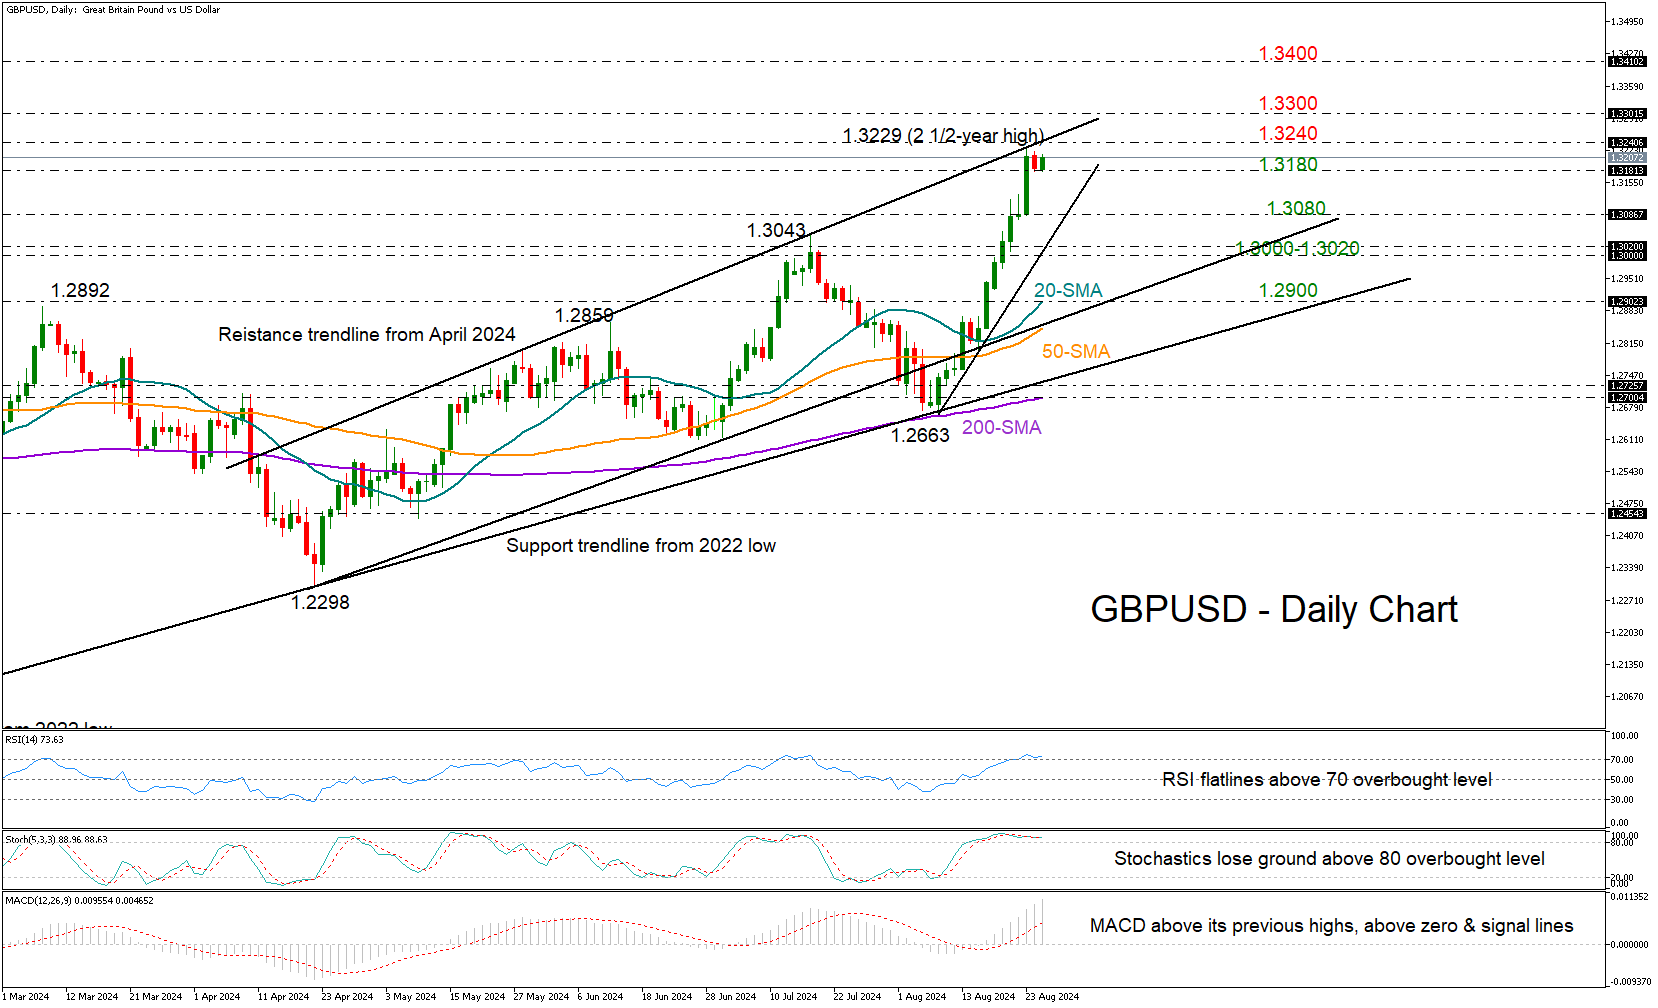
GBP/USD: Is the next downturn approaching?
GBP/USD opened the week with marginal losses after its almost uninterrupted two-week rally was rejected near the key resistance trendline at 1.3229 for the third time. While the bulls are trying to make a comeback today, the RSI and Stochastic oscillator are both flatlining in the overbought zone, indicating a high risk of a downside correction.
Perhaps, a step below the 1.3180 area, which has been acting as support for the second consecutive day, could confirm additional losses towards the 1.3025-1.3085 zone. If the steep ascending trendline from August’s lows is broken along with the 1.3000 psychological mark too, it could lead to a rapid decline towards the 20- and 50-day simple moving averages (SMA) found between 1.2890-1.2900. Read more...
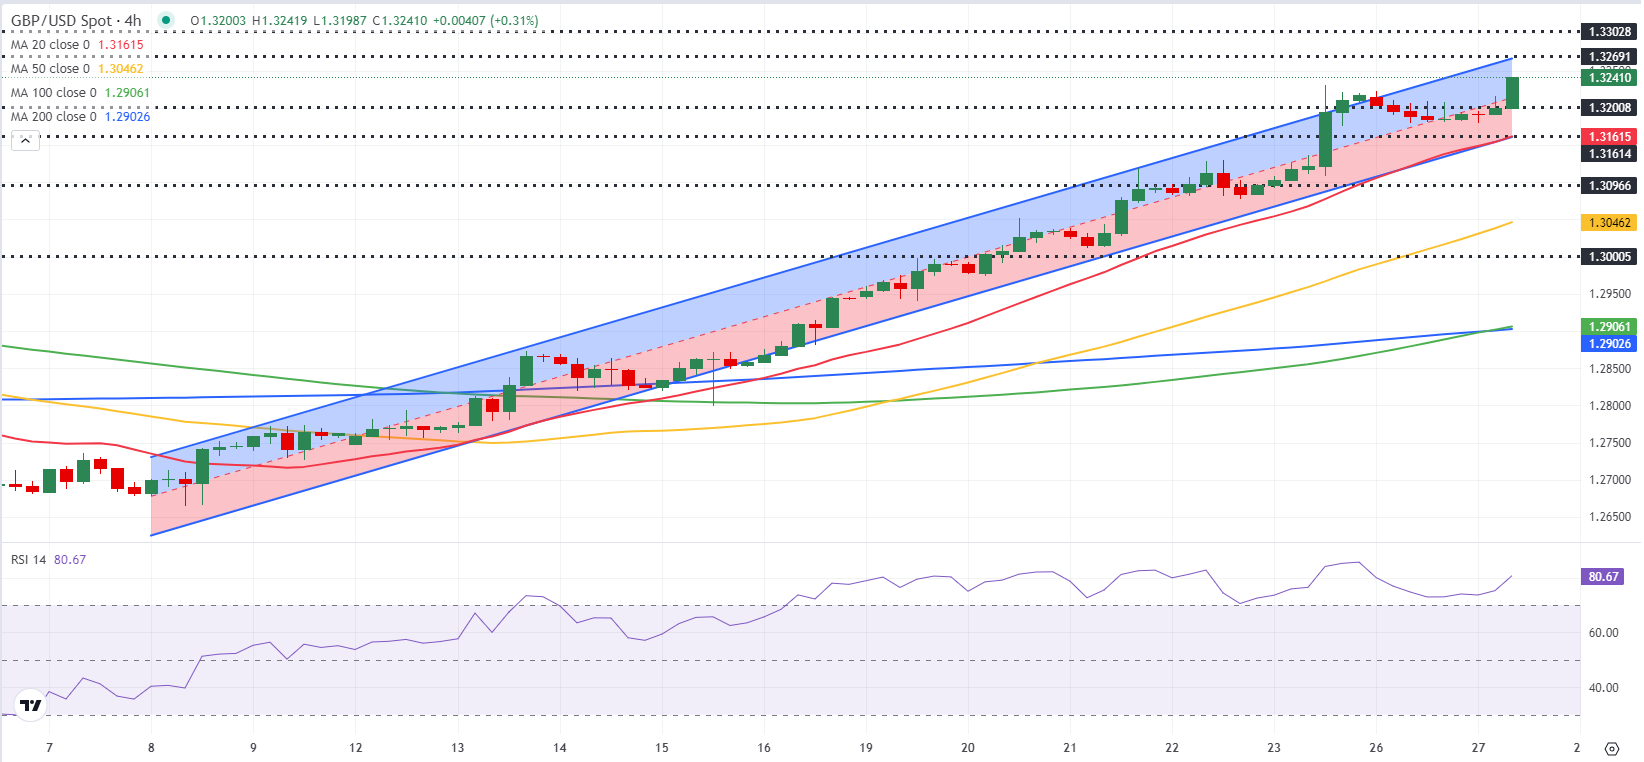
Elliott Wave intraday shows bullish sequence in GBP/USD [Video]
GBP/USD recently broke above previous peak on 7.14.2023 high at 1.3143 and shows a higher high bullish sequence from 9.26.2022 low. This leaves no doubt about the right side and direction of the pair which is higher. Near term, rally from 4.22.2024 low is ongoing as a 5 waves impulse Elliott Wave structure. Up from 4.22.2024 low, wave 1 ended at 1.3045 and pullback in wave 2 ended at 1.266. Pair has turned higher and broken above wave 1 suggesting wave 3 is in progress.
Up from wave 2, wave (i) ended at 1.277 and dips in wave (ii) ended at 1.272. Pair extended higher again from there. Up from wave (ii), wave i ended at 1.287 and pullback in wave ii ended at 1.2798. Pair extended higher in wave iii towards 1.313 and wave iv pullback ended at 1.307. Final leg wave v ended at 1.323 which completed wave (iii). Expect pair to end wave (iv) and rally 1 more leg to end wave (v) which should complete wave ((i)). Then it should pullback in wave ((ii)) to correct cycle from 8.8.2024 low in 3, 7, 11 swing before the rally resumes. Read more...
Author
FXStreet Team
FXStreet
Composed of a group of economic journalists and FX experts, the FXStreet content team produces and oversees all content published on FXStreet. It provides a purely journalistic approach to the Forex market.


