Platinum Price Analysis: XPT/USD stays on the way to $830-29 support zone


  • Platinum price fades bounce off six-week low as sellers keep reins below 200-DMA.
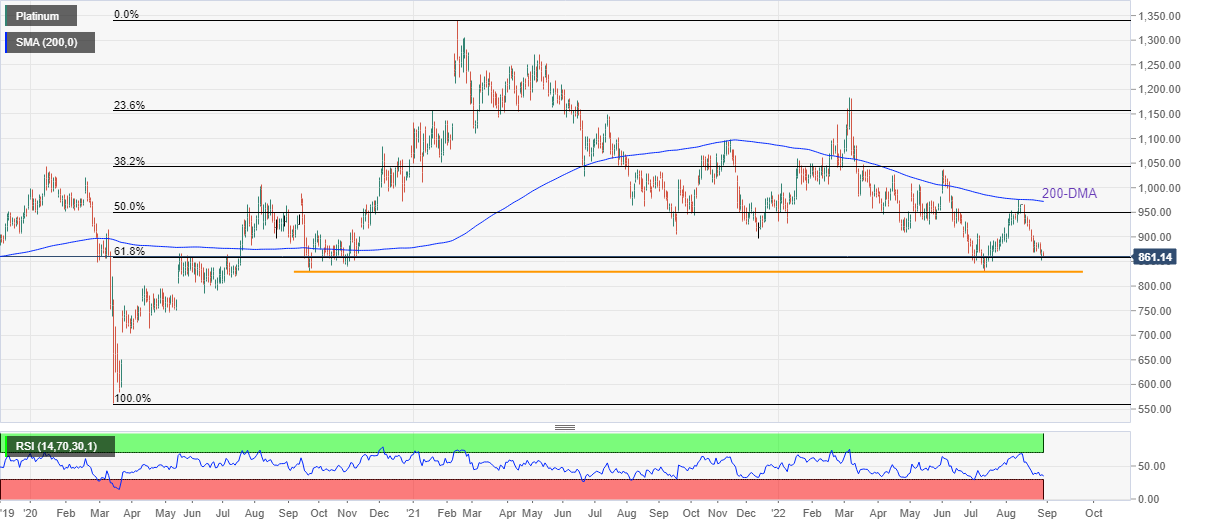
  • 61.8% Fibonacci retracement lures bears ahead of the key 23-month-old horizontal support.
  • Nearly oversold RSI hints at limited downside room.

Platinum price (XPT/USD) holds lower grounds near $860 amid the early Tuesday morning in Europe. That said, the precious metal bounced off a 1.5-month low the previous day but couldn’t keep buyers on the board.

Given the quote’s sustained weakness below the 200-DMA, around $972.00 by the press time, XPT/USD is likely to remain pressured around the 61.8% Fibonacci retracement level of March 2020 to February 2021 upside, near $858.00.

In a case where bears manage to conquer the $858.00 support, the horizontal area comprising lows marked during September 2020 and in July 2022 could challenge the platinum bears around $830-29.00.

It should be noted that the XPT/USD south-run past $830.00 could make it vulnerable to breaking the $800 threshold while targeting June 2020 lows around $784.00.

Meanwhile, recovery remains elusive until the quote stays below the 200-DMA level surrounding $972.00, a break of which will propel the quote towards the $1,000 psychological magnet.

Even so, nearly oversold RSI might trigger the XPT/USD rebound targeting April’s swing low near $910.00.

To sum up, platinum is likely to remain on the bear’s radar unless crossing the 200-DMA. However, RSI approaches oversold territory and hints at a limited downside room.

Platinum: Daily chart

Trend: Limited downside expected

Additional important levels

Overview
Today last price 862.02
Today Daily Change -6.73
Today Daily Change % -0.77%
Today daily open 868.75
 
Trends
Daily SMA20 916.44
Daily SMA50 894.76
Daily SMA100 927.64
Daily SMA200 971.73
 
Levels
Previous Daily High 875.35
Previous Daily Low 851.47
Previous Weekly High 902.73
Previous Weekly Low 864.31
Previous Monthly High 907.54
Previous Monthly Low 829.32
Daily Fibonacci 38.2% 866.23
Daily Fibonacci 61.8% 860.59
Daily Pivot Point S1 855.03
Daily Pivot Point S2 841.31
Daily Pivot Point S3 831.15
Daily Pivot Point R1 878.91
Daily Pivot Point R2 889.07
Daily Pivot Point R3 902.79


Share: Feed news

Information on these pages contains forward-looking statements that involve risks and uncertainties. Markets and instruments profiled on this page are for informational purposes only and should not in any way come across as a recommendation to buy or sell in these assets. You should do your own thorough research before making any investment decisions. FXStreet does not in any way guarantee that this information is free from mistakes, errors, or material misstatements. It also does not guarantee that this information is of a timely nature. Investing in Open Markets involves a great deal of risk, including the loss of all or a portion of your investment, as well as emotional distress. All risks, losses and costs associated with investing, including total loss of principal, are your responsibility. The views and opinions expressed in this article are those of the authors and do not necessarily reflect the official policy or position of FXStreet nor its advertisers. The author will not be held responsible for information that is found at the end of links posted on this page.

If not otherwise explicitly mentioned in the body of the article, at the time of writing, the author has no position in any stock mentioned in this article and no business relationship with any company mentioned. The author has not received compensation for writing this article, other than from FXStreet.

FXStreet and the author do not provide personalized recommendations. The author makes no representations as to the accuracy, completeness, or suitability of this information. FXStreet and the author will not be liable for any errors, omissions or any losses, injuries or damages arising from this information and its display or use. Errors and omissions excepted.

The author and FXStreet are not registered investment advisors and nothing in this article is intended to be investment advice.

Recommended content


Recommended content

Editors’ Picks

EUR/USD clings to gains above 1.0750 after US data

EUR/USD clings to gains above 1.0750 after US data

EUR/USD manages to hold in positive territory above 1.0750 despite retreating from the fresh multi-week high it set above 1.0800 earlier in the day. The US Dollar struggles to find demand following the weaker-than-expected NFP data.

EUR/USD News

GBP/USD declines below 1.2550 following NFP-inspired upsurge

GBP/USD declines below 1.2550 following NFP-inspired upsurge

GBP/USD struggles to preserve its bullish momentum and trades below 1.2550 in the American session. Earlier in the day, the disappointing April jobs report from the US triggered a USD selloff and allowed the pair to reach multi-week highs above 1.2600.

GBP/USD News

Gold struggles to hold above $2,300 despite falling US yields

Gold struggles to hold above $2,300 despite falling US yields

Gold stays on the back foot below $2,300 in the American session on Friday. The benchmark 10-year US Treasury bond yield stays in negative territory below 4.6% after weak US data but the improving risk mood doesn't allow XAU/USD to gain traction.

Gold News

Bitcoin Weekly Forecast: Should you buy BTC here? Premium

Bitcoin Weekly Forecast: Should you buy BTC here?

Bitcoin (BTC) price shows signs of a potential reversal but lacks confirmation, which has divided the investor community into two – those who are buying the dips and those who are expecting a further correction.

Read more

Week ahead – BoE and RBA decisions headline a calm week

Week ahead – BoE and RBA decisions headline a calm week

Bank of England meets on Thursday, unlikely to signal rate cuts. Reserve Bank of Australia could maintain a higher-for-longer stance. Elsewhere, Bank of Japan releases summary of opinions.

Read more

Forex MAJORS

Cryptocurrencies

Signatures