Oil back above $78 with NFP confirming timing on Fed rate cuts
- WTI Oil turns flat in the US Jobs Report aftermath.
- Oil traders are betting on a pickup in demand as interest-rate cuts should spur economic growth.
- The US Dollar Index fell below the 103.00 level, trading in the lower-102.00s after NFP

Oil prices are flat, despite earlier looking set to head to $80 level, as investors seem to bet on an improved demand outlook. The upmove came after dovish comments from US Federal Reserve Chairman Jerome Powell, who said in a two-day hearing in Congress that the Fed is ready to cut interest rates. Lower rates are likely to spur economic growth, and this could mean more demand for Oil.
The US Dollar, however, didn’t like this message. The US Dollar Index (DXY), which tracks the Greenback against a basket of foreign currencies, fell sharply on Thursday. With the US Dollar weakening, Oil prices have room to rise in the correlation between the Greenback and the commodity. The downbeat revisions in Nonfarm Payrolls and the Average Hourly Wages got crushed by rising only 0.1%, which points to less demand and less willingness to pay for attracting the right employee.
Crude Oil (WTI) trades at $78.15 per barrel, and Brent Oil trades at $82.35 per barrel at the time of writing.
Oil news and market movers: NFP set the stage for June
- Oil traders are back to placing bullish bets on Oil with the underlying idea that rate interest-rate cuts in both Europe and the US would spur economic growth and thus see a pickup in demand again.
- An increase in demand is already underway inAsia, with India and China buying up every cheap contract in sight as their industrial and travel demand picks up pace. These two sectors are very Oil-consuming.
- The failed ceasefire talks are keeping tensions high in Gaza. Meanwhile both Thursday and this Friday reports are coming in from more Houthi attacks in the Red Sea.
- This Friday, the Baker Hughes Oil Rig Count is set to be released at 18:00 GMT. The previous count was at 506 rigs.
Oil Technical Analysis: NFP confirms US economy rolling over and Fed cuts needed soon
Oil prices are entering dynamics not seen since 2013, when a substantially weaker US Dollar opened up space for Oil prices to rise towards $100. Seeing the current rate cuts and dovish stance by the Fed, more upside could be at hand.. Although $100 is still far off, chances are growing.
Oil bulls still clearly see more upside potential. The break above $80 though does not seem to be taking place that quickly, and $85 is appearing as the next cap. Further up, $86.90 follows suit before targeting $89.64 and $90.00 as top levels.
On the downside, the 200-day Simple Moving average (SMA) near $77.93 is the first point of contact to provide some support. Quite close behind are the 100-day and the 55-day SMAs near $75.81 and $75.26, respectively. Add the pivotal level near $75.27, and it looks like the downside is very limited and well-equipped to resist the selling pressure.
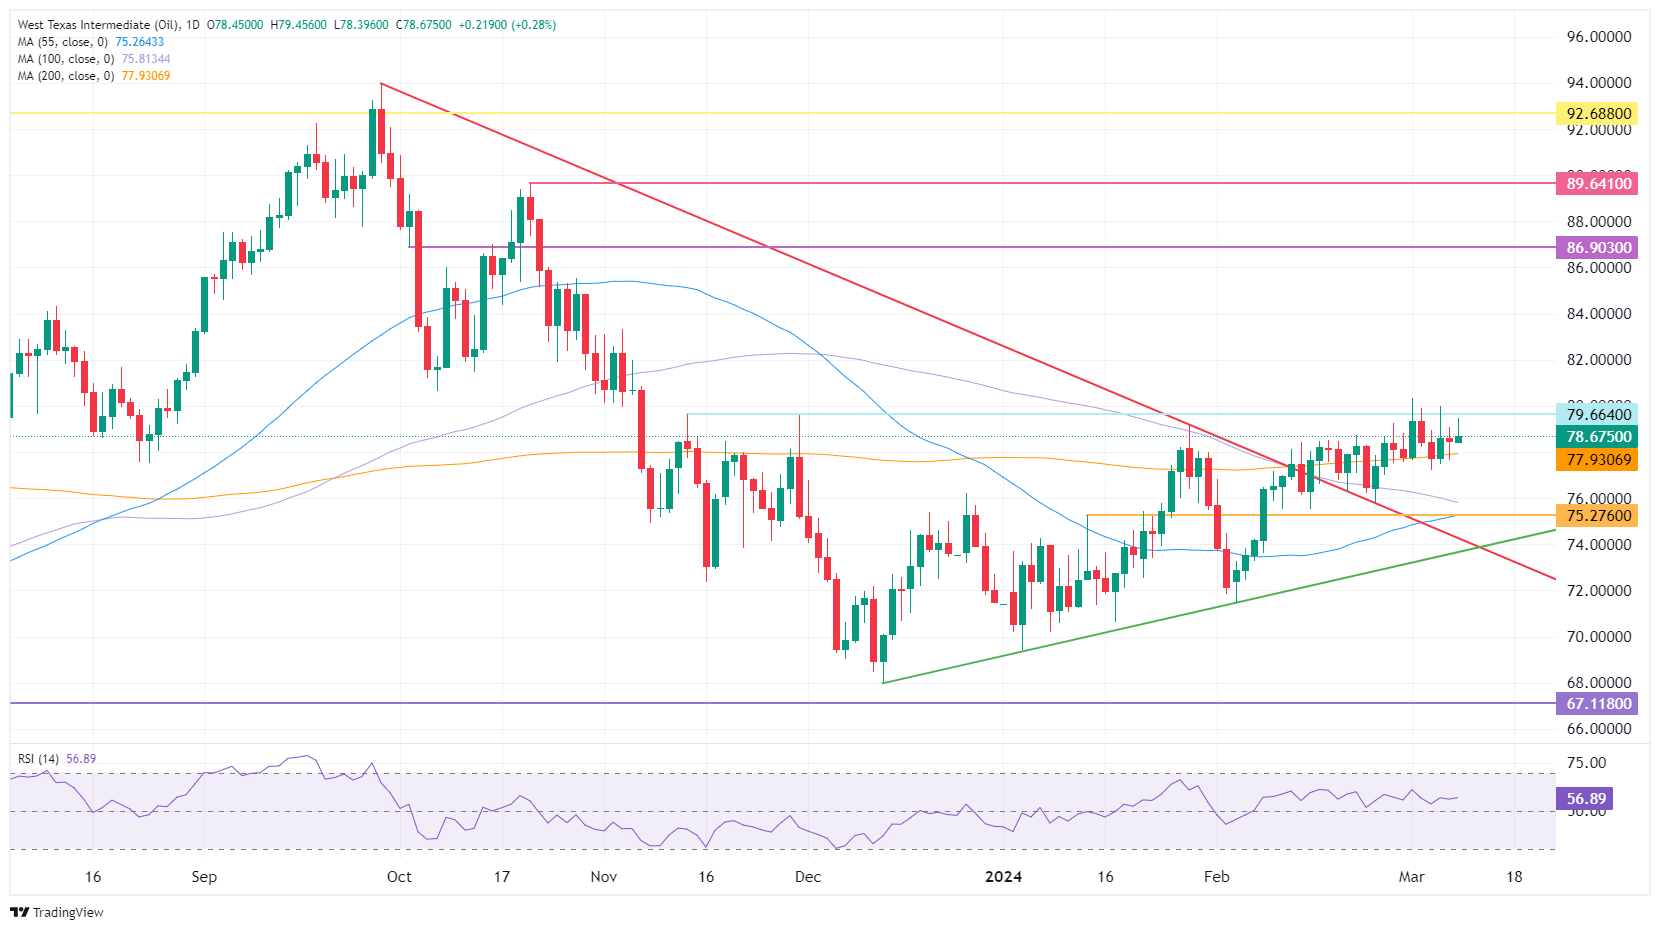
US WTI Crude Oil: Daily Chart
WTI Oil FAQs
WTI Oil is a type of Crude Oil sold on international markets. The WTI stands for West Texas Intermediate, one of three major types including Brent and Dubai Crude. WTI is also referred to as “light” and “sweet” because of its relatively low gravity and sulfur content respectively. It is considered a high quality Oil that is easily refined. It is sourced in the United States and distributed via the Cushing hub, which is considered “The Pipeline Crossroads of the World”. It is a benchmark for the Oil market and WTI price is frequently quoted in the media.
Like all assets, supply and demand are the key drivers of WTI Oil price. As such, global growth can be a driver of increased demand and vice versa for weak global growth. Political instability, wars, and sanctions can disrupt supply and impact prices. The decisions of OPEC, a group of major Oil-producing countries, is another key driver of price. The value of the US Dollar influences the price of WTI Crude Oil, since Oil is predominantly traded in US Dollars, thus a weaker US Dollar can make Oil more affordable and vice versa.
The weekly Oil inventory reports published by the American Petroleum Institute (API) and the Energy Information Agency (EIA) impact the price of WTI Oil. Changes in inventories reflect fluctuating supply and demand. If the data shows a drop in inventories it can indicate increased demand, pushing up Oil price. Higher inventories can reflect increased supply, pushing down prices. API’s report is published every Tuesday and EIA’s the day after. Their results are usually similar, falling within 1% of each other 75% of the time. The EIA data is considered more reliable, since it is a government agency.
OPEC (Organization of the Petroleum Exporting Countries) is a group of 13 Oil-producing nations who collectively decide production quotas for member countries at twice-yearly meetings. Their decisions often impact WTI Oil prices. When OPEC decides to lower quotas, it can tighten supply, pushing up Oil prices. When OPEC increases production, it has the opposite effect. OPEC+ refers to an expanded group that includes ten extra non-OPEC members, the most notable of which is Russia.
Author

Filip Lagaart
FXStreet
Filip Lagaart is a former sales/trader with over 15 years of financial markets expertise under its belt.


