Oil as session's low ahead of this week's EIA numbers
- Oil slides lower again in volatile Wednesday.
- Norway, Ireland and Spain said they will recognize a Palestinian state on May 28.
- The US Dollar Index is trading in a narrow range ahead of an eventful 24 hours.

Oil prices are back in the red, in sync with the sell off in precious metals, on Wednesday as concerns in markets grow after headlines came out that Norway, Ireland and Spain will recognize a Palestinian state in a surprising move. Israel was quick to recall their embassy personnel from those countries. Meanwhile another headline is picking up steam as well with CNN reporting that House Democrats have launched an investigation into Exxon, Chevron & others for illegally colluding with OPEC to inflate prices at the pump.
Meanwhile, the US Dollar Index (DXY), which tracks the performance of the US Dollar against a basket of six major currencies, is breaking out of its tight range for this week ahead of an eventful 24 hours where volatility is expected to increase. Nvidia (NVDA) is set to release its earnings near 16:00 GMT, after which the Federal Reserve (Fed) will publish the Minutes from their latest monetary policy decision. On Thursday, the economic calendar gains traction, with Jobless Claims data having the potential to trigger some waves. In this context, the DXY looks set to break out of its tight range for this week.
At the time of writing, Crude Oil (WTI) trades at $77.42 and Brent Crude at $81.63.
Oil news and market movers: What does this mean for CPI
- CNN's Matt Egan tweets that 'House Democrats have launched an investigation into whether Exxon, Chevron & others illegally colluded with OPEC to inflate prices at the pump.', CNN reports.
- Soft demand and surprisingly robust non-OPEC output growth are aiding supply and keeping prices under control despite mounting geopolitical tension, several traders reported to Bloomberg.
- The American Petroleum Institute (API) overnight reported that US crude inventories increased 2.5 million barrels last week, Reuters reported.
- At 14:30 GMT, the US Energy Information Administration is set to release their findings on the US stock pile change. The previous week saw a draw of 2.508 million barrels, and for this week a bigger draw of 3.1 million barrels is expected.
Oil Technical Analysis: Diving lower
Oil prices are back to flat after the brief downward excursion this Wednesday on the back of the headlines around the Palestinian state. Again all eyes are on the US, which is heavily disrupting the Oil markets by filling in the gap of the OPEC supply cuts. A lot of questions are now arising on the geopolitical front, namely if the US will remain standing by Israel as an ally despite mounting criticism across the globe. A retreat in the Middle East could mean an end to diplomacy with escalations and elevated Oil prices as the end result, a narrow path for the US to navigate through.
On the upside, the line in the sand remains at the 200-day Simple Moving Average (SMA) at $79.61. Once above that level, a double layer comes up with the 100-day SMA at $81.27. In case of an upward extension above that zone, the road is open for $87.12 again.
On the downside, the pivotal level at $75.28 is the last solid line that could support the decline. If this level is unable to hold, investors could expect an accelerated sell-off towards $72.00 and $70.00, erasing all gains for 2024. Further down, Oil price could test $68, the December 13 low.
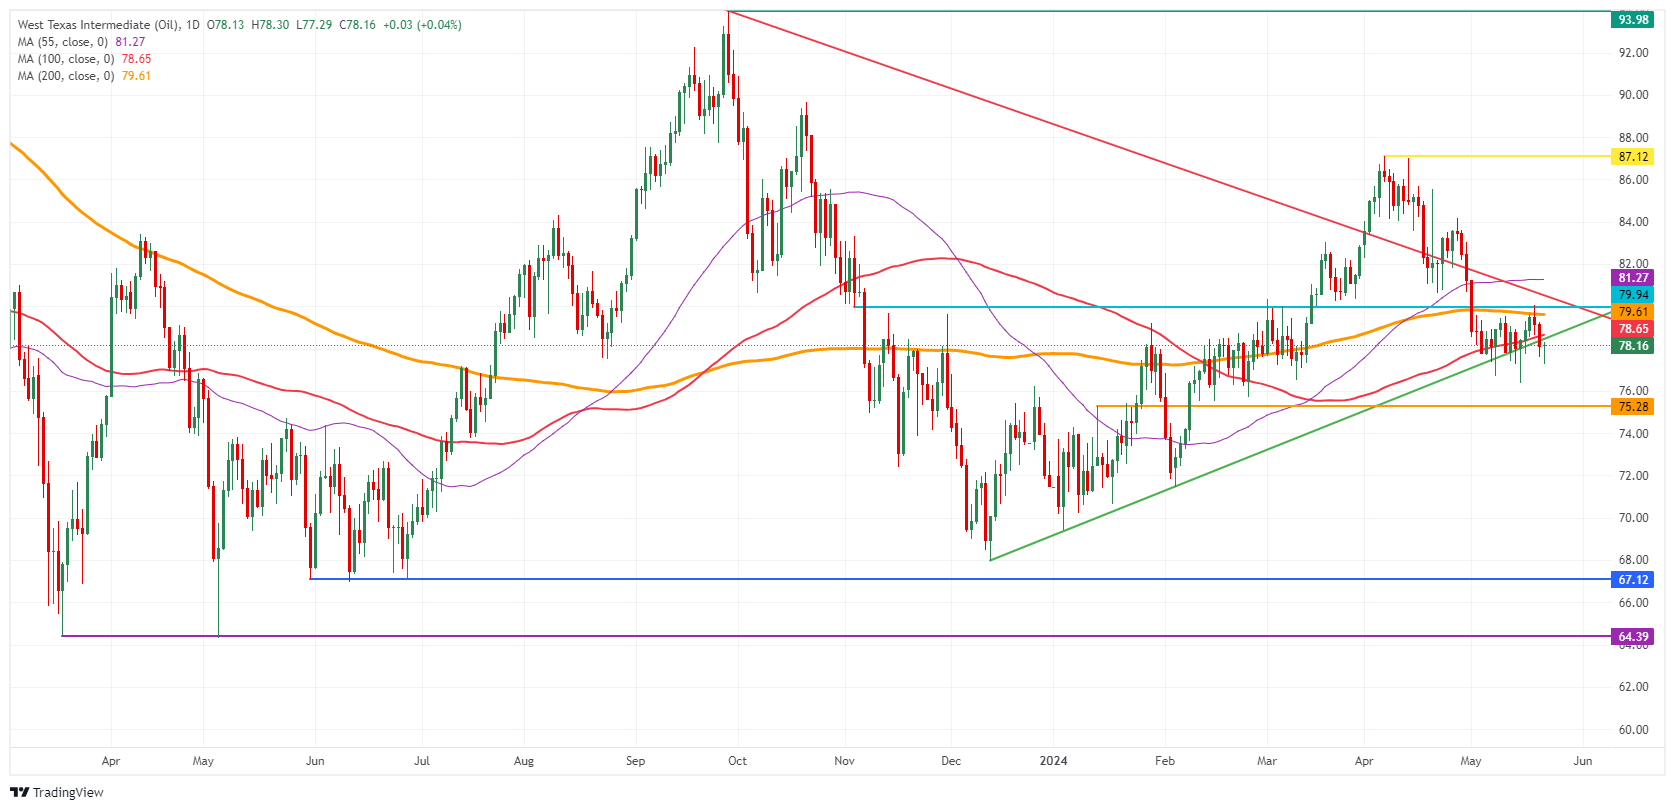
US WTI Crude Oil: Daily Chart
WTI Oil FAQs
WTI Oil is a type of Crude Oil sold on international markets. The WTI stands for West Texas Intermediate, one of three major types including Brent and Dubai Crude. WTI is also referred to as “light” and “sweet” because of its relatively low gravity and sulfur content respectively. It is considered a high quality Oil that is easily refined. It is sourced in the United States and distributed via the Cushing hub, which is considered “The Pipeline Crossroads of the World”. It is a benchmark for the Oil market and WTI price is frequently quoted in the media.
Like all assets, supply and demand are the key drivers of WTI Oil price. As such, global growth can be a driver of increased demand and vice versa for weak global growth. Political instability, wars, and sanctions can disrupt supply and impact prices. The decisions of OPEC, a group of major Oil-producing countries, is another key driver of price. The value of the US Dollar influences the price of WTI Crude Oil, since Oil is predominantly traded in US Dollars, thus a weaker US Dollar can make Oil more affordable and vice versa.
The weekly Oil inventory reports published by the American Petroleum Institute (API) and the Energy Information Agency (EIA) impact the price of WTI Oil. Changes in inventories reflect fluctuating supply and demand. If the data shows a drop in inventories it can indicate increased demand, pushing up Oil price. Higher inventories can reflect increased supply, pushing down prices. API’s report is published every Tuesday and EIA’s the day after. Their results are usually similar, falling within 1% of each other 75% of the time. The EIA data is considered more reliable, since it is a government agency.
OPEC (Organization of the Petroleum Exporting Countries) is a group of 13 Oil-producing nations who collectively decide production quotas for member countries at twice-yearly meetings. Their decisions often impact WTI Oil prices. When OPEC decides to lower quotas, it can tighten supply, pushing up Oil prices. When OPEC increases production, it has the opposite effect. OPEC+ refers to an expanded group that includes ten extra non-OPEC members, the most notable of which is Russia.
Author

Filip Lagaart
FXStreet
Filip Lagaart is a former sales/trader with over 15 years of financial markets expertise under its belt.


