- NZD/USD is recovering in a throwback move to the neckline of a topping pattern it recently pierced.
- The pair is at a critical point – whilst the odds favor a resumption of the downside bias, a continuation higher is possible.
- A break below the June 26 low would confirm a continuation down to a target for the topping pattern.
NZD/USD has formed a complex multi-peak topping pattern which is at risk of breaking down now that the pair’s “neckline” – the level underpinning its trough lows – at around 0.6100, has been decisively pierced.
NZD/USD 4-hour Chart
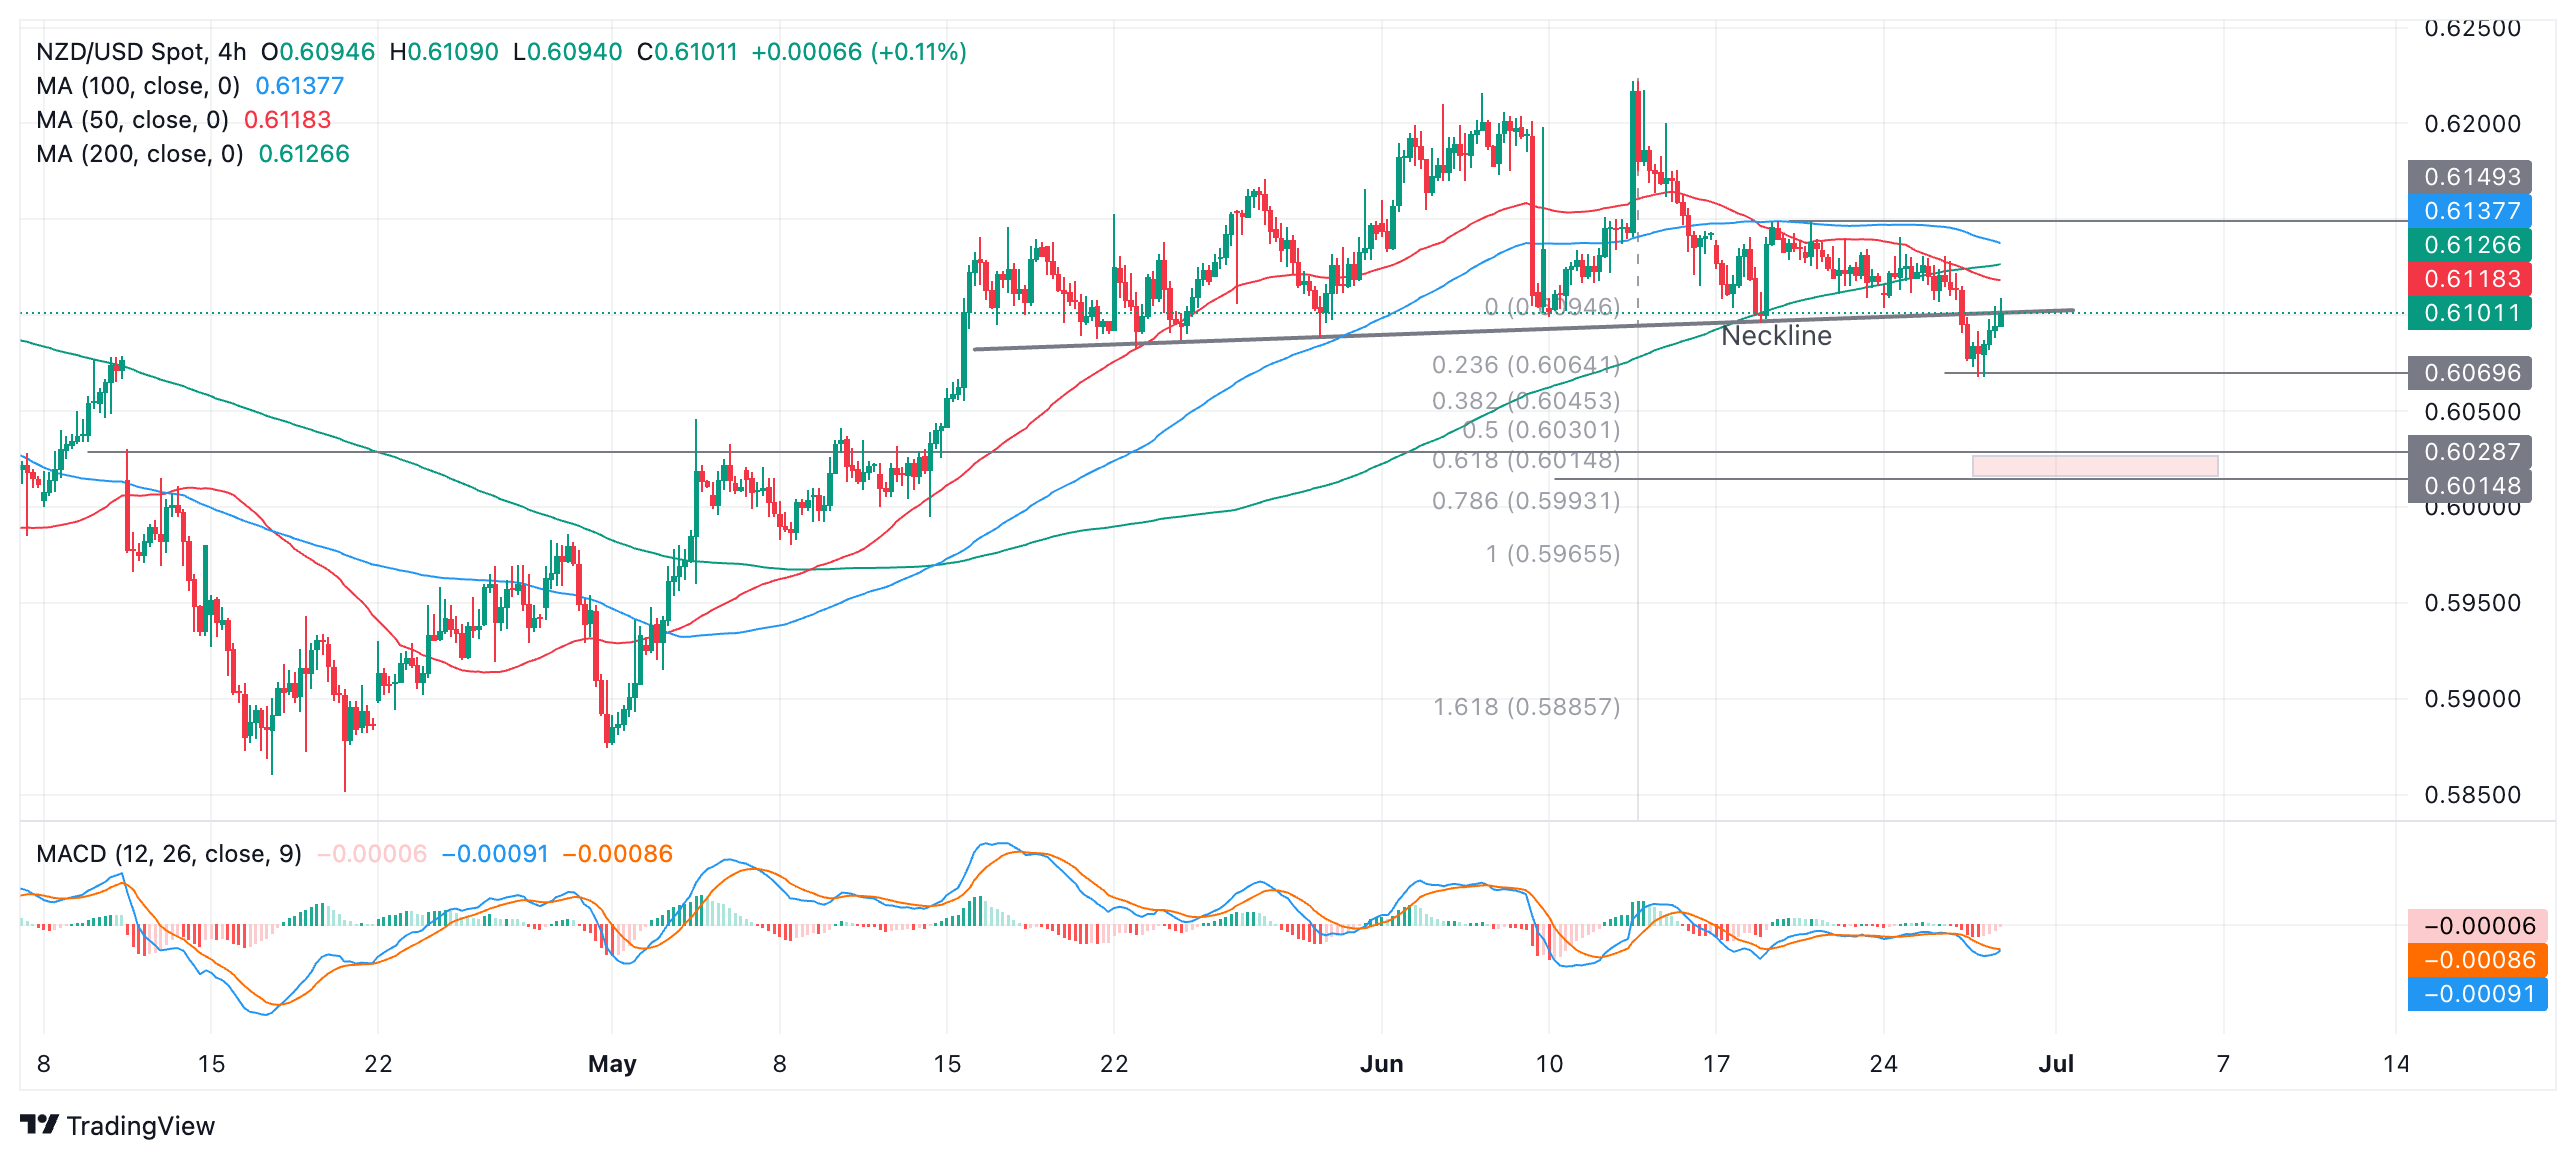
NZD/USD pierced cleanly through the neckline on June 26 and fell to a low of 0.6068. However, it quickly mounted a recovery and returned back to the neckline.
The recovery back up to the neckline could be what is called a “throwback” in technical parlance. This is a move that comes immediately after a breakout from a chart pattern in which the price recovers back to the original boundary line, or in this case neckline.
The throwback is usually only a temporary recovery before price surrenders to the overwhelming downwards pressure and falls back down to the pattern’s breakout target. However, this is not always the case and sometimes price will recover.
A break below the June 26 low at 0.6068 would provide confirmation of a resumption of the downmove, to a target in a zone (shaded red) between 0.6028 (bottom of April 10 price gap) and 0.6015, the Fibonacci 0.618 extension of the height of the pattern.
This is a conservative estimate and it is possible the pair could go even lower to 0.5965, the 100% extrapolation of the height of the pattern from the neckline lower.
A break above the 0.6149 (June 13 and 14 high) would invalidate the break and the pattern and possibly indicate a continuation higher instead.
Information on these pages contains forward-looking statements that involve risks and uncertainties. Markets and instruments profiled on this page are for informational purposes only and should not in any way come across as a recommendation to buy or sell in these assets. You should do your own thorough research before making any investment decisions. FXStreet does not in any way guarantee that this information is free from mistakes, errors, or material misstatements. It also does not guarantee that this information is of a timely nature. Investing in Open Markets involves a great deal of risk, including the loss of all or a portion of your investment, as well as emotional distress. All risks, losses and costs associated with investing, including total loss of principal, are your responsibility. The views and opinions expressed in this article are those of the authors and do not necessarily reflect the official policy or position of FXStreet nor its advertisers. The author will not be held responsible for information that is found at the end of links posted on this page.
If not otherwise explicitly mentioned in the body of the article, at the time of writing, the author has no position in any stock mentioned in this article and no business relationship with any company mentioned. The author has not received compensation for writing this article, other than from FXStreet.
FXStreet and the author do not provide personalized recommendations. The author makes no representations as to the accuracy, completeness, or suitability of this information. FXStreet and the author will not be liable for any errors, omissions or any losses, injuries or damages arising from this information and its display or use. Errors and omissions excepted.
The author and FXStreet are not registered investment advisors and nothing in this article is intended to be investment advice.
Recommended content
Editors’ Picks

EUR/USD accelerates losses to 1.0930 on stronger Dollar
The US Dollar's recovery regains extra impulse sending the US Dollar Index to fresh highs and relegating EUR/USD to navigate the area of daily troughs around 1.0930 in the latter part of Friday's session.

GBP/USD plummets to four-week lows near 1.2850
The US Dollar's rebound keep gathering steam and now sends GBP/USD to the area of multi-week lows in the 1.2850 region amid the broad-based pullback in the risk-associated universe.

Gold trades on the back foot, flirts with $3,000
Gold prices are accelerating their daily decline, steadily approaching the critical $3,000 per troy ounce mark as the Greenback's rebound gains extra momentum and US yields tighten their retracement.

Can Maker break $1,450 hurdle as whales launch buying spree?
Maker holds steadily above $1,250 support as a whale scoops $1.21 million worth of MKR. Addresses with a 100k to 1 million MKR balance now account for 24.27% of Maker’s total supply. Maker battles a bear flag pattern as bulls gather for an epic weekend move.

Strategic implications of “Liberation Day”
Liberation Day in the United States came with extremely protectionist and inward-looking tariff policy aimed at just about all U.S. trading partners. In this report, we outline some of the more strategic implications of Liberation Day and developments we will be paying close attention to going forward.

The Best brokers to trade EUR/USD
SPONSORED Discover the top brokers for trading EUR/USD in 2025. Our list features brokers with competitive spreads, fast execution, and powerful platforms. Whether you're a beginner or an expert, find the right partner to navigate the dynamic Forex market.