|
NZD/USD technical analysis: Kiwi is under pressure near 0.6500 figure ahead of NZ Retail Sales
- The New Zealand Retail Sales for the first quarter (QoQ) will be published at 22:45 GMT this Tuesday.
- A worse-than-expected reading can keep the pressure on the NZD/USD currency pair.

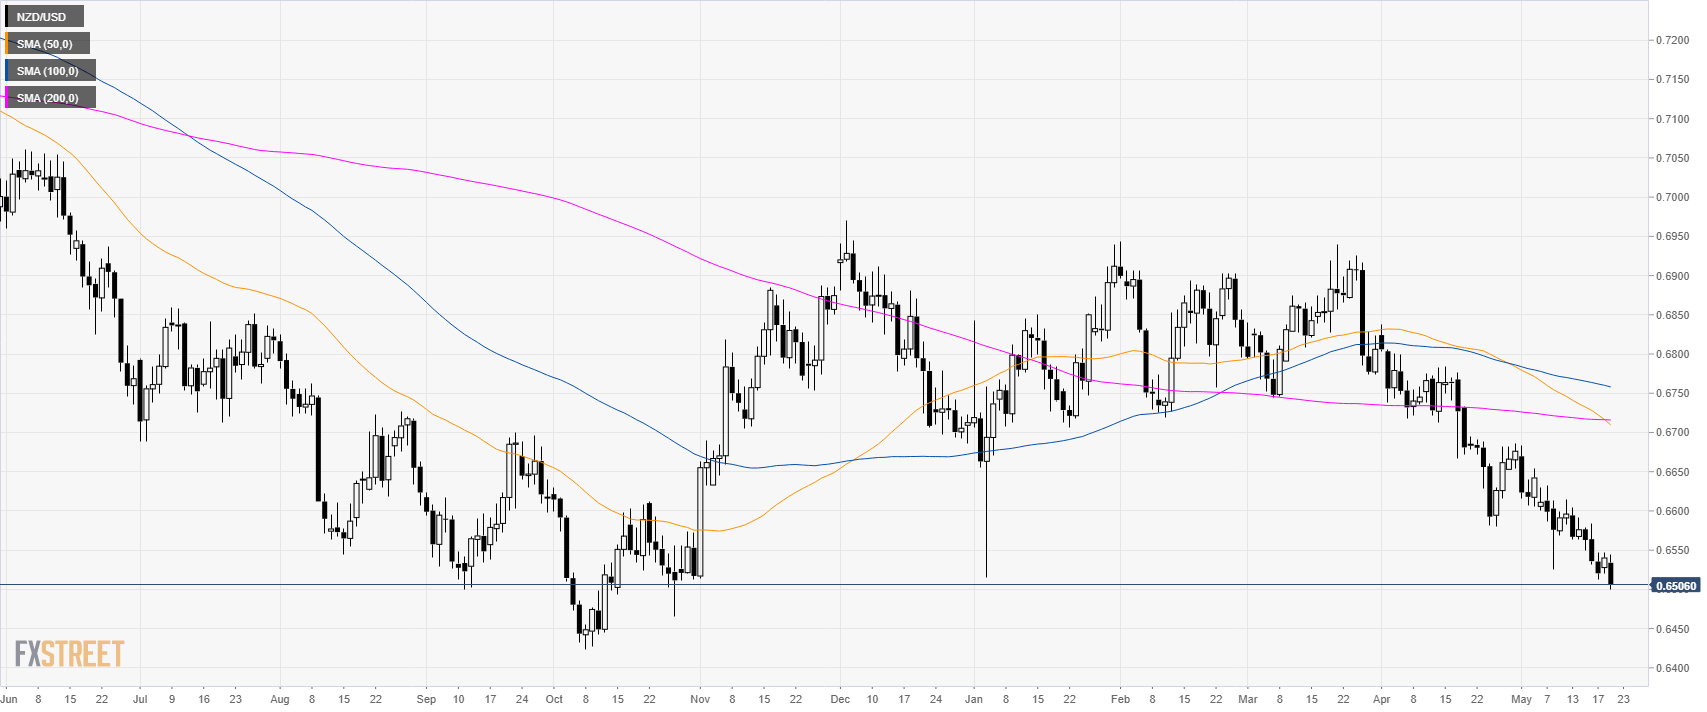
NZD/USD daily chart
NZD/USD is trading in a steep bear trend below the 0.6600 handle and its main simple moving averages (SMAs). The market is reaching levels not seen since November 2018.
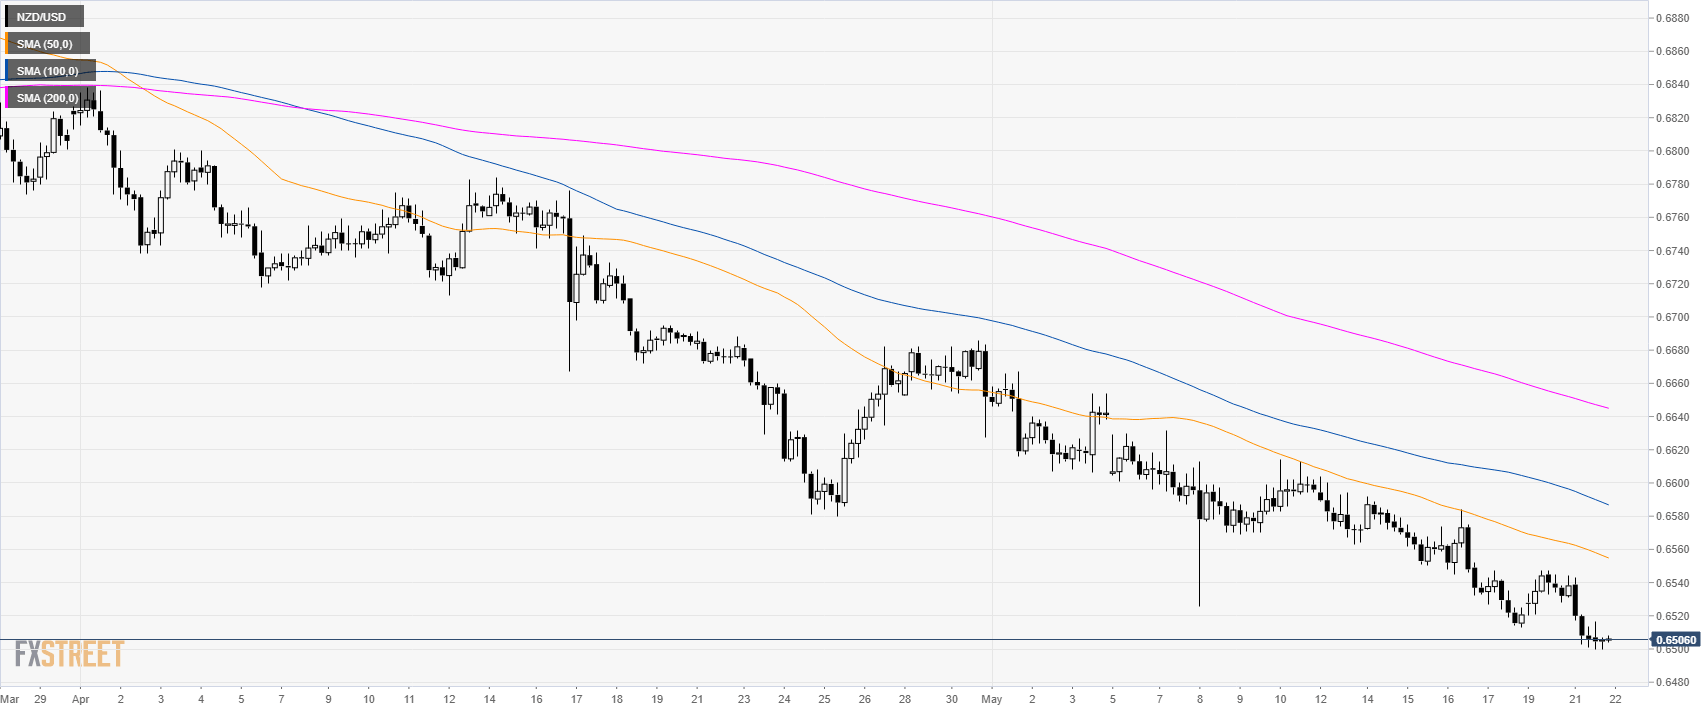
NZD/USD 4-hour chart
NZD/USD is trading below its main SMAs suggesting a bearish bias in the medium term.
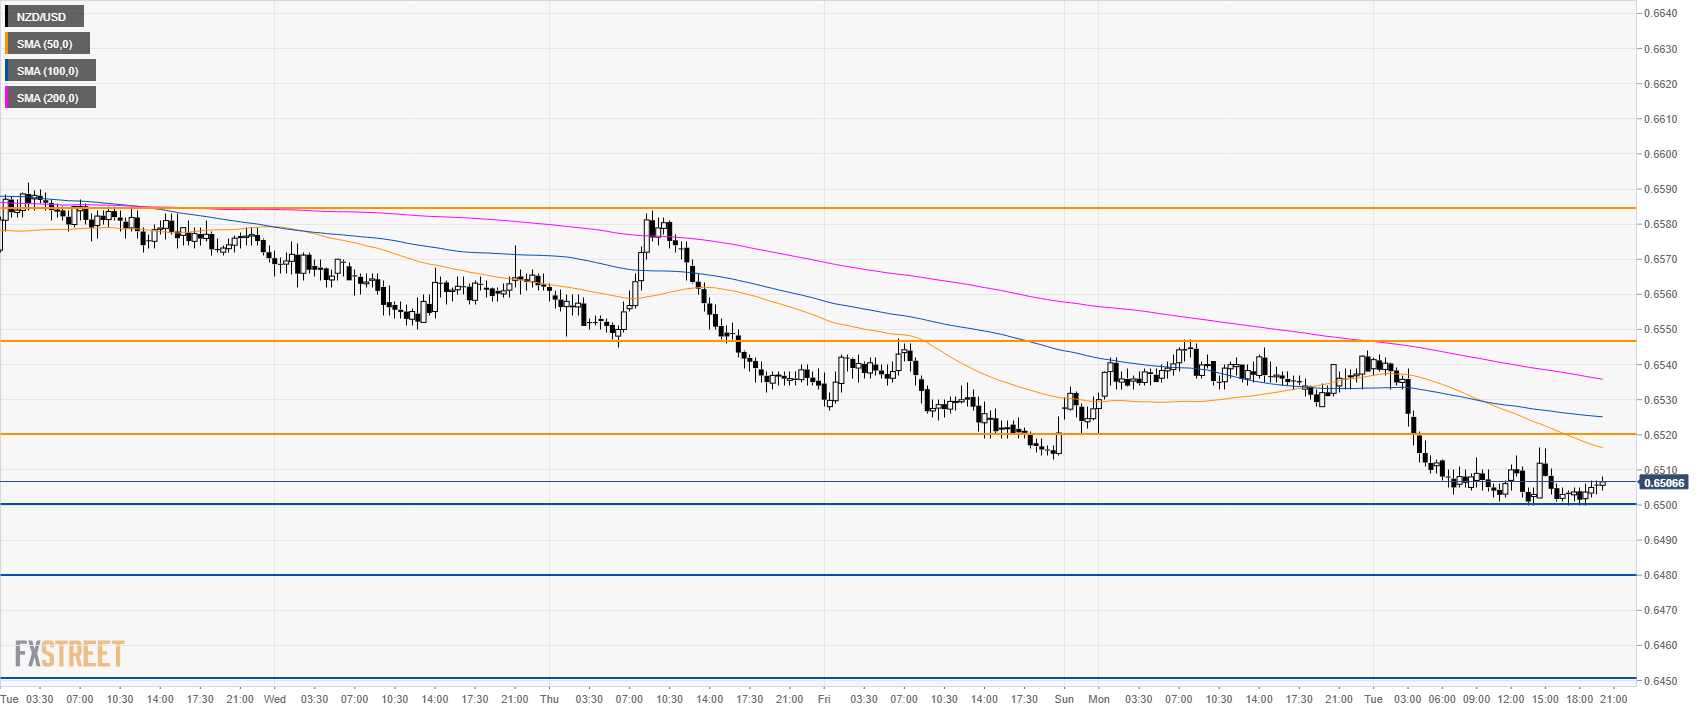
NZD/USD 30-minute chart
NZD/USD is trading in a bear trend below its main SMAs. A break below 0.6500 figure can open the gates to 0.6480 and 0.6450 level. On the way up, resistance is expected at 0.6520 and 0.6547 level.
Additional key levels
Author

Flavio Tosti
Independent Analyst
More from Flavio Tosti


