|

NZD/USD Technical Analysis: Break of 61.8% Fibonacci, bearish MACD signal further declines

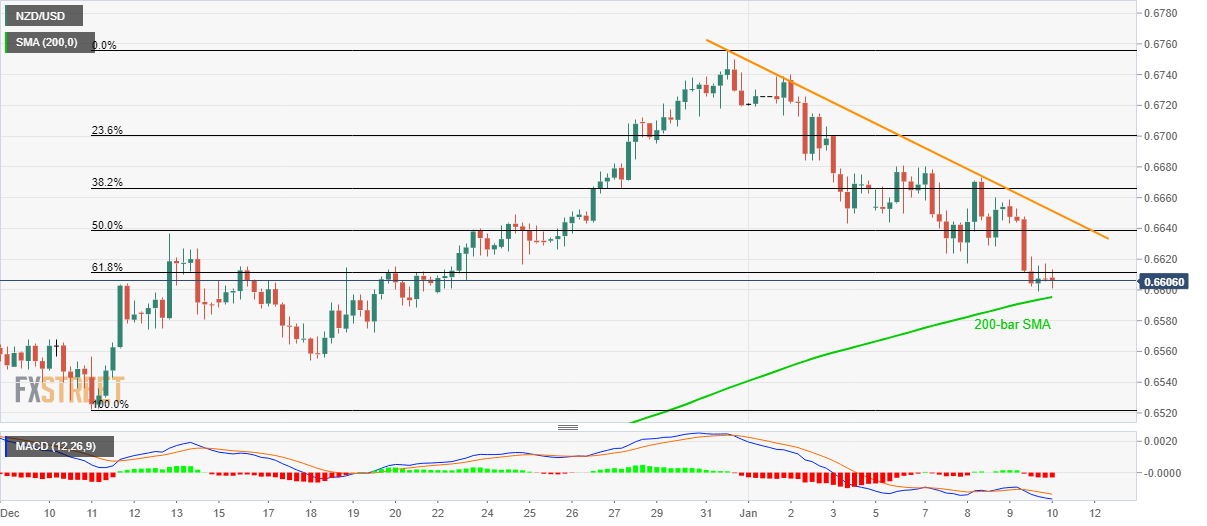
  • NZD/USD seesaws around 14-day low after breaking 61.8% Fibonacci retracement.
  • 200-bar SMA limits immediate declines, December 18 bottom on seller’s radar.
  • A descending trend line since December 31 adds to the resistance.

NZD/USD declines to 0.6600, following its sustained trading below 61.8% Fibonacci retracement of December month rise, during early Friday.

While bearish MACD signal further declines by the pair, a 200-bar SMA level of 0.6595 acts as the nearest support holding the keys to December 18 low surrounding 0.6554.

If NZD/USD prices keep trading south after 0.6554, the December month low near 0.6520 and 0.6500 round-figure could return to the chart.

On the flip side, short-term falling trend line resistance, at 0.6652 now, can keep the pair under pressure, a break of which will recall 0.6700 mark for buyers.

However, December top near 0.6755 and July 2019 high around 0.6792 will question the Bulls afterward.

NZD/USD daily chart

Trend: Bearish

Additional important levels

Overview
Today last price0.6607
Today Daily Change-4 pips
Today Daily Change %-0.06%
Today daily open0.6611
 
Trends
Daily SMA200.6647
Daily SMA500.6524
Daily SMA1000.6432
Daily SMA2000.6519
 
Levels
Previous Daily High0.6659
Previous Daily Low0.6599
Previous Weekly High0.6756
Previous Weekly Low0.6643
Previous Monthly High0.6756
Previous Monthly Low0.6424
Daily Fibonacci 38.2%0.6622
Daily Fibonacci 61.8%0.6636
Daily Pivot Point S10.6587
Daily Pivot Point S20.6563
Daily Pivot Point S30.6527
Daily Pivot Point R10.6647
Daily Pivot Point R20.6683
Daily Pivot Point R30.6707

Author

Anil Panchal

Anil Panchal

FXStreet

Anil Panchal has nearly 15 years of experience in tracking financial markets. With a keen interest in macroeconomics, Anil aptly tracks global news/updates and stays well-informed about the global financial moves and their implications.

More from Anil Panchal
Share:

Editor's Picks

EUR/USD hovers above 1.1800 as USD stabilizes

EUR/USD treads water above 1.1800 in the European session on Thursday. The US Dollar stabilizes, following the recent decline fuelled by concerns about the economic fallout from US President Trump's erratic trade policies, capping the pair's upside. All eyes now remain on Lagarde's speech and US-Iran nuclear talks. 

GBP/USD extends recovery to near 20-day EMA as US Dollar weakens

The Pound Sterling holds onto weekly gains around 1.3565 against the US Dollar during the Asian trading session on Thursday. The GBP/USD pair trades firmly as the US Dollar remains under pressure due to uncertainty surrounding the United States trade policy outlook.

Gold clings to gains amid sustained safe-haven flows ahead of US-Iran talks

Gold sticks to its modest intraday gains through the first half of the European session on Thursday, with bulls still awaiting a sustained move and acceptance above the $5,200 mark before placing fresh bets. 

Stellar: Relief bounce fades as bearish undertone persists

Stellar is trading around $0.16 at the time of writing on Thursday after rebounding more than 8% in the previous day. Derivatives data paints a negative picture as XLM’s short bets hit a monthly high while Open Interest continues to decline.

Nvidia delivers another monster earnings report, and forecasts big things to come

It was another monster earnings report from Nvidia for fiscal Q4. Revenues were $68.1bn, smashing estimates of $65bn. Gross profit margin was a healthy 75%, up from 73.5% in the prior quarter, and the outlook for this quarter was monstrous.

Solana strikes key resistance with double-digit gains

Solana trades at $88 at press time on Thursday, after an 11% upswing the previous day within a broader consolidation range of roughly three weeks. Institutional demand for Solana heightens as US spot SOL Exchange Traded Funds record $30 million of inflow on Wednesday.