|

NZD/USD rebounds into 0.6000 as US Dollar falls back on NFP buzzer-beater

  • The NZD/USD is bounding higher as the US Dollar falls back on NFP data beats.
  • Kiwi catches enough lift to tap the 0.6000 major level post-NFP.
  • The Kiwi is now grasping to stay flat on the week.

Friday markets are seeing a broad reversal of the week's flows after the US Non-Farm Payrolls (NFP) figures came ion well above expectations, with the US economy adding 336K jobs, well above the forecast decline to 170K and easily beating the previous figure which was revised from 187K to 220K.

US Nonfarm Payrolls soar by 336,000 in September vs. 170,000 forecast

With the US NFP barrelshot out of the way, markets are stepping away from the US Dollar (USD) to close out the trading week, and the NZD/USD has rebounded from Friday's low of 0.5923 and is now trading back slightly into 0.5980 after briefly tipping into the 0.6000 major handle.

Markets will be rounding the corner into a sedate trading window next week, and meaningful data isn't expected until Wednesday's US Producer Price Index (PPI) figures as well as the Federal Reserve's (Fed) Federal Open Market Committee (FOMC) which will be dropping their latest meeting minutes for investors to review.

NZD/USD technical outlook

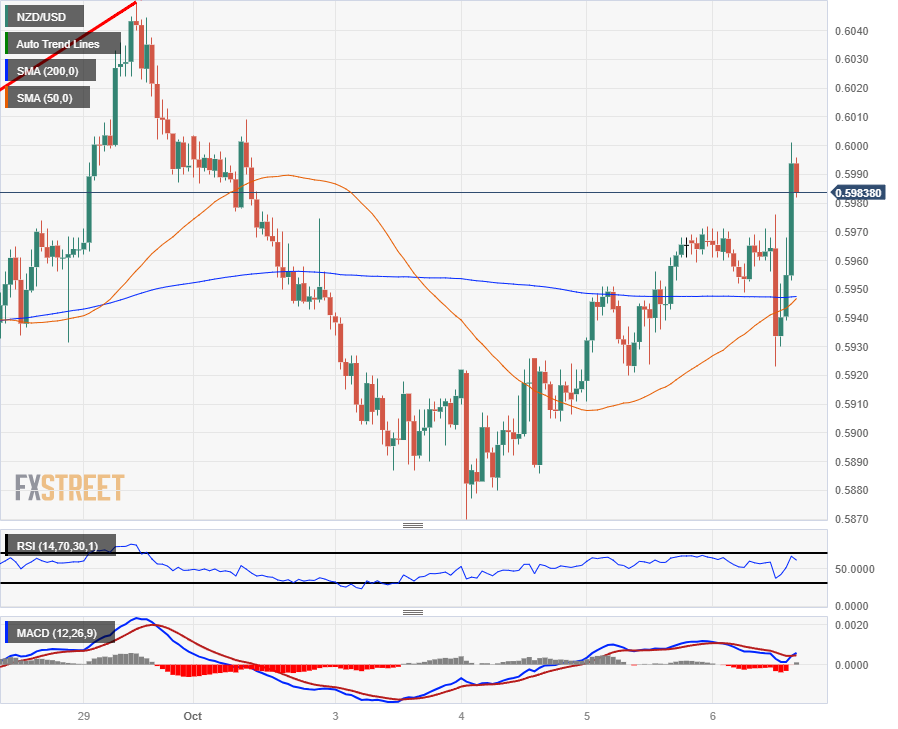
The NZD/USD pinged 0.6000 following the US Dollar's broad-market fallback, sending the pair back into the week's opening bids. The pair has climbed 2.2% from the week's bottom near 0.5870, and the Kiwi is set to fall back heading into the Friday close.

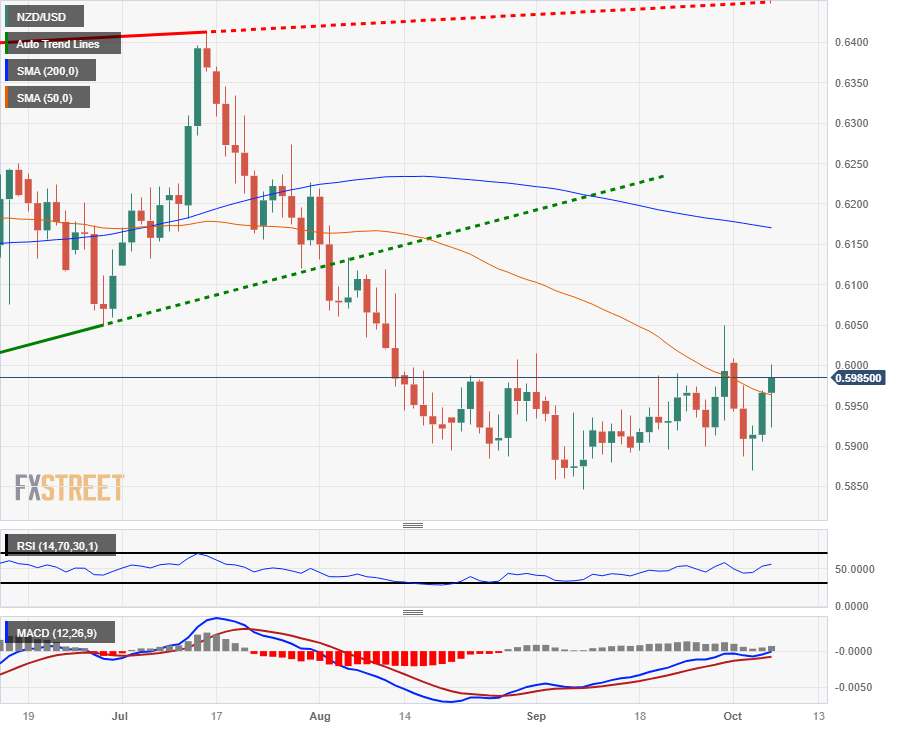
On the daily candlesticks the NZD/USD still remains firmly planted in consolidation territory, trading into the 50-day Simple Moving Average (SMA) with the 200-day SMA firmly entrenched just north of 0.6150.

September's bottom of 0.5846 still remains a key technical floor, but the pair is still well off recent highs, down 6.7% from July's peak into 0.6415.

NZD/USD hourly chart

NZD/USD daily chart

NZD/USD technical levels

NZD/USD

Overview
Today last price0.5989
Today Daily Change0.0023
Today Daily Change %0.39
Today daily open0.5966
 
Trends
Daily SMA200.5932
Daily SMA500.5967
Daily SMA1000.6067
Daily SMA2000.6171
 
Levels
Previous Daily High0.5969
Previous Daily Low0.5906
Previous Weekly High0.605
Previous Weekly Low0.5899
Previous Monthly High0.605
Previous Monthly Low0.5847
Daily Fibonacci 38.2%0.5945
Daily Fibonacci 61.8%0.593
Daily Pivot Point S10.5925
Daily Pivot Point S20.5884
Daily Pivot Point S30.5862
Daily Pivot Point R10.5988
Daily Pivot Point R20.601
Daily Pivot Point R30.6051

Author

Joshua Gibson

Joshua joins the FXStreet team as an Economics and Finance double major from Vancouver Island University with twelve years' experience as an independent trader focusing on technical analysis.

More from Joshua Gibson
Share:

Markets move fast. We move first.

Orange Juice Newsletter brings you expert driven insights - not headlines. Every day on your inbox.

By subscribing you agree to our Terms and conditions.

Editor's Picks

EUR/USD remains below 1.1700 amid weakening momentum

EUR/USD remains steady after four days of losses, trading around 1.1680 during the Asian hours on Thursday. On the daily chart, the 14-day Relative Strength Index at 42.6 (neutral-bearish) indicates weakening momentum after slipping below the 50 midline. RSI staying sub-50 would keep bears engaged and limit recovery attempts.

GBP/USD consolidates above mid-1.3400s; bullish potential seems intact

The GBP/USD pair is seen consolidating its heavy losses registered over the past two days and oscillating in a narrow trading band, just above mid-1.3400s during the Asian session on Thursday. However, the fundamental backdrop warrants some caution for bearish traders and before positioning for an extension of the retracement slide from the 1.3565-1.3570 region, or the highest level since September 18, touched on Tuesday.

Gold: Deeper correction or dip-buying likely?

Gold is nursing losses near $4,450 in Asian trading on Thursday, having suffered about a 1% correction from weekly highs of $4,500 on Wednesday. All eyes remain on the geopolitical developments and the incoming US jobless claims data for fresh trading directives.

Top Crypto Losers: Pump.fun, Story, and Pudgy Penguins test key support levels

Pump.fun, Story, and Pudgy Penguins experience intense selling pressure over the last 24 hours. PUMP and IP failed to cross the 50-day Exponential Moving Average, resulting in a pullback on Wednesday, while PENGU is testing its 50-day EMA.

2026 economic outlook: Clear skies but don’t unfasten your seatbelts yet

Most years fade into the background as soon as a new one starts. Not 2025: a year of epochal shifts, in which the macroeconomy was the dog that did not bark. What to expect in 2026? The shocks of 2025 will not be undone, but neither will they be repeated.

XRP battles selling pressure as profit-taking, ETF inflows shape outlook

Ripple (XRP) is trading downward but holding support at $2.22 at the time of writing on Wednesday, as fear spreads across the cryptocurrency market, reversing gains made from the start of the year.