|

NZD/USD re-taps 0.6200 for the second time in a week as hawkish RBNZ bolsters Kiwi

  • The NZD/USD gains three-quarters of a percent on Friday to etch in a seventh straight gain.
  • The Kiwi is up 2% against the US Dollar heading into the tail end of Friday's trading session.
  • Thin Kiwi data next week gives way to another bout of US NFP data next Friday.

The NZD/USD is continuing its climb as the Kiwi (NZD) stands out as the single best-performing currency of the major currencies bloc, up 2% against the US Dollar (USD) for the trading week.

An improving economic outlook coupled with a hawkish Reserve Bank of New Zealand (RBNZ) is bolstering the NZD across the board. The Kiwi is climbing into the 0.6200 handle against the Greenback for the second time in three days.

The RBNZ held interest rates at 5.5% this week, but a hawkish stance from New Zealand’s central bank is propping up the Kiwi, with RBNZ officials actively weighing additional rate hikes with inflation continuing to fall outside of the RBNZ’s target 1-3% band for so long.

Consumer sentiment and business outlook surveys continue to rise, with the New Zealand ANZ Roy Morgan Consumer Confidence survey index rising to a yearly high of 91.9 early Friday, adding further momentum to the NZD/USD heading into the week’s end.

Next week has a fairly thin showing for the Kiwi on the economic data calendar, but eyes will be turning towards next Friday’s US Non-Farm Payrolls release, where the US is expected to see a marginal gain in the number of new job hires from 150K to 170K in November.

NZD/USD Technical Outlook

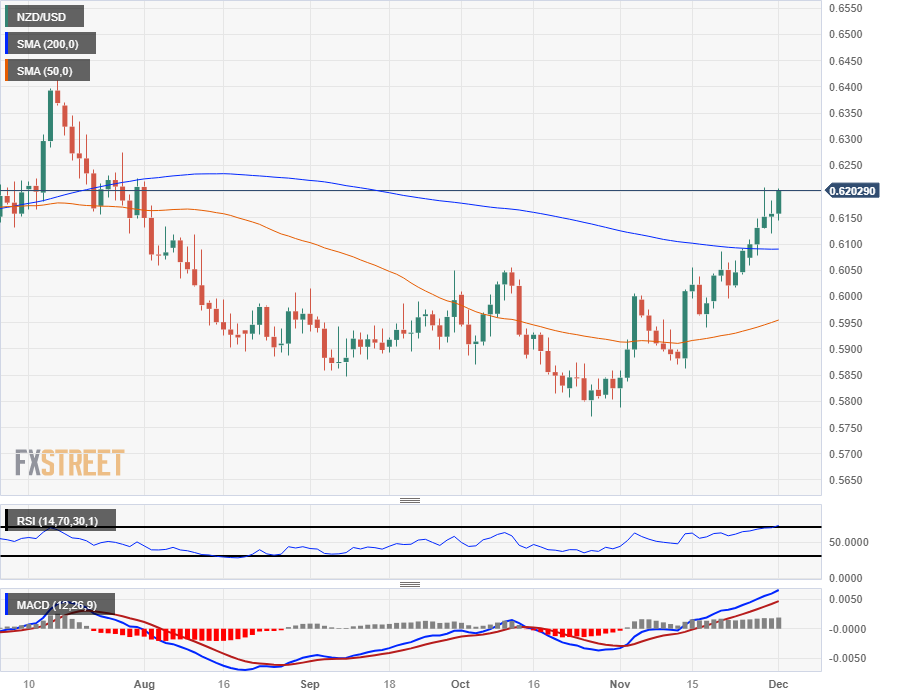
The NZD/USD is set to close in the green for twelve of the last fourteen consecutive trading days, and as long as the pair holds near the 0.6200 handle into the Friday closing bell that will etch in seven straight days of gains.

The Kiwi-Dollar pairing has climbed 7.5% from October’s bottom bids of 0.5772, and a continuation of recent bullish momentum will see a new long-term trend form up and take a challenge run at July’s swing high into 0.6400.

The NZD/USD easily slipped through the 200-day Simple Moving Average (SMA) last week as the Kiwi’s near-term trend rotates firmly bullish, and bulls will be fresh and ready for a leg higher as long as a retracement doesn’t take the pair back below the 200-day SMA at the 0.6100 handle.

NZD/USD Daily Chart
NZD/USD Technical Levels

NZD/USD

Overview
Today last price0.6201
Today Daily Change0.0043
Today Daily Change %0.70
Today daily open0.6158
 
Trends
Daily SMA200.6013
Daily SMA500.595
Daily SMA1000.5988
Daily SMA2000.6089
 
Levels
Previous Daily High0.6183
Previous Daily Low0.6121
Previous Weekly High0.6092
Previous Weekly Low0.5978
Previous Monthly High0.6208
Previous Monthly Low0.5788
Daily Fibonacci 38.2%0.6159
Daily Fibonacci 61.8%0.6145
Daily Pivot Point S10.6125
Daily Pivot Point S20.6092
Daily Pivot Point S30.6063
Daily Pivot Point R10.6187
Daily Pivot Point R20.6216
Daily Pivot Point R30.6249

Author

Joshua Gibson

Joshua joins the FXStreet team as an Economics and Finance double major from Vancouver Island University with twelve years' experience as an independent trader focusing on technical analysis.


More from Joshua Gibson
Share:

Editor's Picks

GBP/USD bounces off four-day lows, still below 1.3500

GBP/USD sticks to the bearish tone on Thursday, coming down to the 1.3480 region in the latter part of the NA session. In the meantime, Cable’s weakness comes as investors continue to assess mixed UK data, poor US results, and the persistent uncertainty surrounding the US-Iran conflict.

EUR/USD looks apathetic around 1.1530

EUR/USD reverses Wednesday’s downtick and trades with modest gains in the 1.1530 region following the end of the NA session on Thursday. The pair’s tepid advance comes on the back of the absence of clear direction in the US Dollar despite tensions from the Middle East appear far from alleviated. Later on Friday, investors are expected to monitor the the releases of another revision of GDP figures in the Euroland, US Retail Sales and the preliminary U-Mich gauge.

Gold loses the grip, recedes toward $4,350

Gold extends its intraday pullback on Thursday, retesting the $4,350 zone per troy ounce, or three-day troughs. Meanwhile, the yellow metal continues to monitor developments from the Middle East as well as bets surrounding the potential Fed’s rate path.

Ethereum Price Forecast: Fidelity plans to add staking to ETH ETF amid yield debate
Asset manager Fidelity has filed with the US Securities and Exchange Commission (SEC) to permit staking in its Ethereum (ETH) exchange-traded fund (ETF), the Fidelity Ethereum Fund (FETH), which holds over $898 million in net assets.
Why credit markets aren’t pricing $570B of AI debt

Forecasts put global artificial intelligence related debt issuance near $570 billion this year, with roughly $236 billion of it priced by the end of May at four times the prior year's pace. Data centre securitisation alone has gone from about $4 billion a year through 2022 to roughly $10 billion in each of 2023 and 2024, and then $27 billion in 2025.

Why is Crude Oil priced for a reopening the ships haven't made?
Fourteen vessels crossed the Strait of Hormuz on Tuesday. Before the war, the count ran near 120 a day. In the sessions since the waterway was publicly declared open, Brent has drifted back to $87 and West Texas Intermediate (WTI) to $81, both a little lower again on Wednesday, with daily momentum on each unwound from the top of its range in late July to the low twenties now.