NZD/USD Price Forecast: Unconvinced buyers maintain the pair afloat


Share:
  • Mixed US macroeconomic data partially weighed on the American Dollar.
  • Chinese focus on economic growth boosted optimism among speculative interest.
  • NZD/USD is at risk of extending its latest decline, particularly once below 0.6230.

A broadly weaker US Dollar helped NZD/USD to peak at 0.6317 on Tuesday but finished the day in the red at around 0.6245. Commodity-linked currencies surged throughout the first half of the day amid a better market mood weighing on the greenback but managed to recover some ground ahead of the close.

The Canadian Dollar was the weakest, as oil prices turned sharply lower in the final hour of trading, followed by the NZD, which shed ground despite encouraging Chinese headlines. According to different news agencies, the country is moving further away from its zero-covid policy as the focus has gyrated towards economic growth. There were also headlines indicating that the local health system is stressed amid multiplying contagions, but it was not enough to overshadow the good mood.

US data released following the long weekend was generally discouraging. The US November Trade Balance posted a deficit of $83.3 billion, improving from the previous deficit of $98.8 billion. Wholesale Inventories for the same month were up 1%, worse than the 0.7% expected, while the October Housing Price Index remained pat. Finally, the December Dallas Fed Manufacturing Business Index contracted to -18.8 from -14.4 in the previous month.

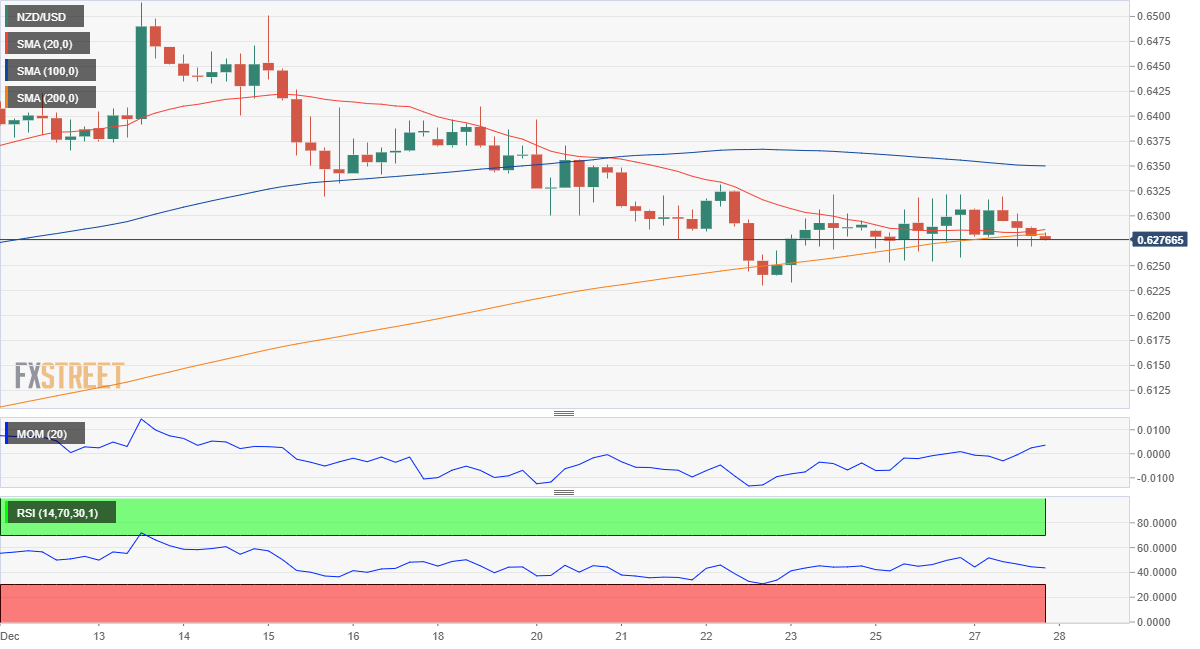
NZD/USD Technical Outlook

The NZD/USD pair’s near-term outlook favors the downside, as in the 4-hour chart, the pair trades below a flat 20 SMA, while technical indicators head nowhere just below their midlines. The intraday low at 0.6230 provides immediate support, later followed by 0.6155. The mentioned 20 SMA currently stands at around 0.6270, the level to surpass to confirm further gains towards the 0.6340 price zone.

NZD/USD

Overview
Today last price 0.6278
Today Daily Change -0.0011
Today Daily Change % -0.17
Today daily open 0.6289
 
Trends
Daily SMA20 0.6347
Daily SMA50 0.611
Daily SMA100 0.6043
Daily SMA200 0.6254
 
Levels
Previous Daily High 0.6322
Previous Daily Low 0.6253
Previous Weekly High 0.641
Previous Weekly Low 0.623
Previous Monthly High 0.6314
Previous Monthly Low 0.5741
Daily Fibonacci 38.2% 0.6295
Daily Fibonacci 61.8% 0.6279
Daily Pivot Point S1 0.6254
Daily Pivot Point S2 0.6219
Daily Pivot Point S3 0.6185
Daily Pivot Point R1 0.6323
Daily Pivot Point R2 0.6357
Daily Pivot Point R3 0.6392


Share: Feed news

Information on these pages contains forward-looking statements that involve risks and uncertainties. Markets and instruments profiled on this page are for informational purposes only and should not in any way come across as a recommendation to buy or sell in these assets. You should do your own thorough research before making any investment decisions. FXStreet does not in any way guarantee that this information is free from mistakes, errors, or material misstatements. It also does not guarantee that this information is of a timely nature. Investing in Open Markets involves a great deal of risk, including the loss of all or a portion of your investment, as well as emotional distress. All risks, losses and costs associated with investing, including total loss of principal, are your responsibility. The views and opinions expressed in this article are those of the authors and do not necessarily reflect the official policy or position of FXStreet nor its advertisers. The author will not be held responsible for information that is found at the end of links posted on this page.

If not otherwise explicitly mentioned in the body of the article, at the time of writing, the author has no position in any stock mentioned in this article and no business relationship with any company mentioned. The author has not received compensation for writing this article, other than from FXStreet.

FXStreet and the author do not provide personalized recommendations. The author makes no representations as to the accuracy, completeness, or suitability of this information. FXStreet and the author will not be liable for any errors, omissions or any losses, injuries or damages arising from this information and its display or use. Errors and omissions excepted.

The author and FXStreet are not registered investment advisors and nothing in this article is intended to be investment advice.

Follow us on Telegram

Stay updated of all the news

Join Telegram

Recommended content


Follow us on Telegram

Stay updated of all the news

Join Telegram

Recommended content

Editors’ Picks

EUR/USD recovers modestly from 2023-low, trades below 1.0500

EUR/USD recovers modestly from 2023-low, trades below 1.0500

EUR/USD dropped to a fresh 2023-low near 1.0450 on Tuesday before staging a modest rebound. After the data from the US showed that the number of job openings rose unexpectedly in August, the US Dollar extended its rally and caused the pair to turn south in the American session.

EUR/USD News

GBP/USD holds above 1.2050 after US data

GBP/USD holds above 1.2050 after US data

GBP/USD fell sharply to the 1.2050 area with the immediate reaction to the US job openings data but managed to its losses. As safe-haven flows continue to dominate the financial markets, however, the pair finds it difficult to gather recovery momentum.

GBP/USD News

Gold moves closer to $1,800 amid risk-off flows Premium

Gold moves closer to $1,800 amid risk-off flows

Gold price stays under modest bearish pressure and trades below $1,830 in the second half of the day on Tuesday. The benchmark 10-year US Treasury bond yield holds at fresh multi-year highs above 4.7% after upbeat US data, not allowing XAU/USD to gain traction.

Gold News

Chainlink price still trapped in range despite exhausted macro downtrend

Chainlink price still trapped in range despite exhausted macro downtrend

Chainlink price eyes the upper boundary of a range at $8.148. It comes after the macro downtrend concluded, and could be the path to a new confirmed macro uptrend for LINK.

Read more

S&P 500 Forecast: 4,300 becomes resistance for lagging index

S&P 500 Forecast: 4,300 becomes resistance for lagging index

S&P 500 lost 0.74% last week, its fourth consecutive losing streak. Equity index stayed uncertain and closed flat on Monday. Tuesday begins with index shedding ground once more as 4,300 turns into resistance.

Read more

Forex MAJORS

Cryptocurrencies

Signatures