NZD/USD Price Analysis: Volatility squeezes broadly amid a light economic calendar


  • NZD/USD has turned sideways broadly amid an absence of a potential trigger.
  • The US Dollar Index has resumed its downside journey after a less-confident pullback move to near 104.00.
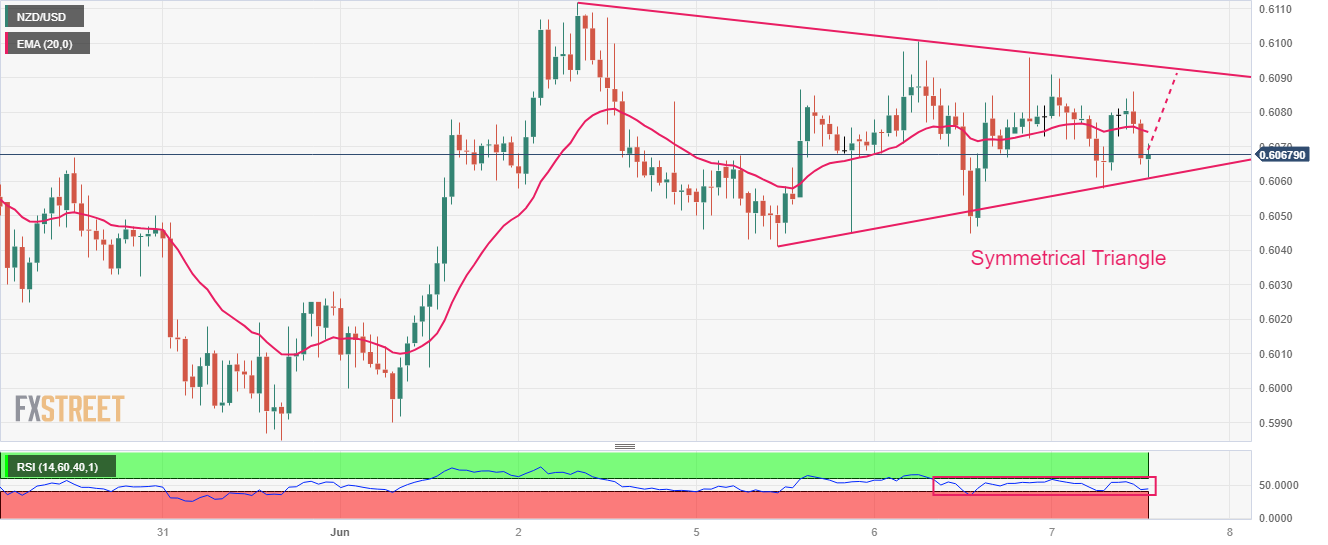
  • NZD/USD is auctioning in a Symmetrical Triangle that indicates a contraction in volatility.

The NZD/USD pair is demonstrating topsy-turvy moves in the early New York session. The Kiwi asset is auctioning in a tight range as investors are divided about the Federal Reserve (Fed)’s interest rate policy for June.

While the United States' solid labor market conditions are propelling the continuation of the rate-hiking spell by the Fed, deteriorating economic activities are telling a different story. The US Dollar Index (DXY) has resumed its downside journey after a less-confident pullback move to near 104.00.

The risk-on market mood has improved the appeal of the risk-perceived assets.

NZD/USD is auctioning in a Symmetrical Triangle chart pattern that indicates a contraction in volatility, which is followed by wider ticks and heavy volume after an explosion. The upward-sloping trendline of the aforementioned chart pattern is plotted from June 05 low at 0.6041 while the downward-sloping trendline is placed from June 02 high at 0.6112.

The 20-period Exponential Moving Average (EMA) at 0.6075 seems sticky to the asset, indicating a sideways performance.

Also, the Relative Strength Index (RSI) (14) has been confined into the 40.00-60.00 range, which signals that investors are awaiting a fresh trigger for a decisive move.

A confident break above May 25 high at 0.6110 will drive the Kiwi asset toward May 01 low at 0.6160 followed by the round-level resistance at 0.6200.

Alternatively, a downside move below the intraday low at 0.6015 will expose the asset for a fresh six-month low toward 11 November 2022 low at 0.5984. A slippage below the latter would expose the asset toward 02 November 2022 high at 0.5941.

NZD/USD hourly chart

NZD/USD

Overview
Today last price 0.6067
Today Daily Change -0.0011
Today Daily Change % -0.18
Today daily open 0.6078
 
Trends
Daily SMA20 0.6154
Daily SMA50 0.6198
Daily SMA100 0.6244
Daily SMA200 0.6149
 
Levels
Previous Daily High 0.61
Previous Daily Low 0.6045
Previous Weekly High 0.6112
Previous Weekly Low 0.5985
Previous Monthly High 0.6385
Previous Monthly Low 0.5985
Daily Fibonacci 38.2% 0.6079
Daily Fibonacci 61.8% 0.6066
Daily Pivot Point S1 0.6049
Daily Pivot Point S2 0.6019
Daily Pivot Point S3 0.5993
Daily Pivot Point R1 0.6104
Daily Pivot Point R2 0.613
Daily Pivot Point R3 0.616


Share: Feed news

Information on these pages contains forward-looking statements that involve risks and uncertainties. Markets and instruments profiled on this page are for informational purposes only and should not in any way come across as a recommendation to buy or sell in these assets. You should do your own thorough research before making any investment decisions. FXStreet does not in any way guarantee that this information is free from mistakes, errors, or material misstatements. It also does not guarantee that this information is of a timely nature. Investing in Open Markets involves a great deal of risk, including the loss of all or a portion of your investment, as well as emotional distress. All risks, losses and costs associated with investing, including total loss of principal, are your responsibility. The views and opinions expressed in this article are those of the authors and do not necessarily reflect the official policy or position of FXStreet nor its advertisers. The author will not be held responsible for information that is found at the end of links posted on this page.

If not otherwise explicitly mentioned in the body of the article, at the time of writing, the author has no position in any stock mentioned in this article and no business relationship with any company mentioned. The author has not received compensation for writing this article, other than from FXStreet.

FXStreet and the author do not provide personalized recommendations. The author makes no representations as to the accuracy, completeness, or suitability of this information. FXStreet and the author will not be liable for any errors, omissions or any losses, injuries or damages arising from this information and its display or use. Errors and omissions excepted.

The author and FXStreet are not registered investment advisors and nothing in this article is intended to be investment advice.

Recommended content


Recommended content

Editors’ Picks

EUR/USD edges lower toward 1.0700 post-US PCE

EUR/USD edges lower toward 1.0700 post-US PCE

EUR/USD stays under modest bearish pressure but manages to hold above 1.0700 in the American session on Friday. The US Dollar (USD) gathers strength against its rivals after the stronger-than-forecast PCE inflation data, not allowing the pair to gain traction.

EUR/USD News

GBP/USD retreats to 1.2500 on renewed USD strength

GBP/USD retreats to 1.2500 on renewed USD strength

GBP/USD lost its traction and turned negative on the day near 1.2500. Following the stronger-than-expected PCE inflation readings from the US, the USD stays resilient and makes it difficult for the pair to gather recovery momentum.

GBP/USD News

Gold struggles to hold above $2,350 following US inflation

Gold struggles to hold above $2,350 following US inflation

Gold turned south and declined toward $2,340, erasing a large portion of its daily gains, as the USD benefited from PCE inflation data. The benchmark 10-year US yield, however, stays in negative territory and helps XAU/USD limit its losses. 

Gold News

Bitcoin Weekly Forecast: BTC’s next breakout could propel it to $80,000 Premium

Bitcoin Weekly Forecast: BTC’s next breakout could propel it to $80,000

Bitcoin’s recent price consolidation could be nearing its end as technical indicators and on-chain metrics suggest a potential upward breakout. However, this move would not be straightforward and could punish impatient investors. 

Read more

Week ahead – Hawkish risk as Fed and NFP on tap, Eurozone data eyed too

Week ahead – Hawkish risk as Fed and NFP on tap, Eurozone data eyed too

Fed meets on Wednesday as US inflation stays elevated. Will Friday’s jobs report bring relief or more angst for the markets? Eurozone flash GDP and CPI numbers in focus for the Euro.

Read more

Forex MAJORS

Cryptocurrencies

Signatures