NZD/USD Price Analysis: Takes a U-turn from 21-day EMA to sub-0.6000 area
- NZD/USD fails to hold onto recovery gains, drops 0.25% in Asia.
- Six-week-old falling trend line, 61.8% Fibonacci retracement add to the resistance.
- 50% Fibonacci retracement, fortnight-long support line on the bears’ radars.

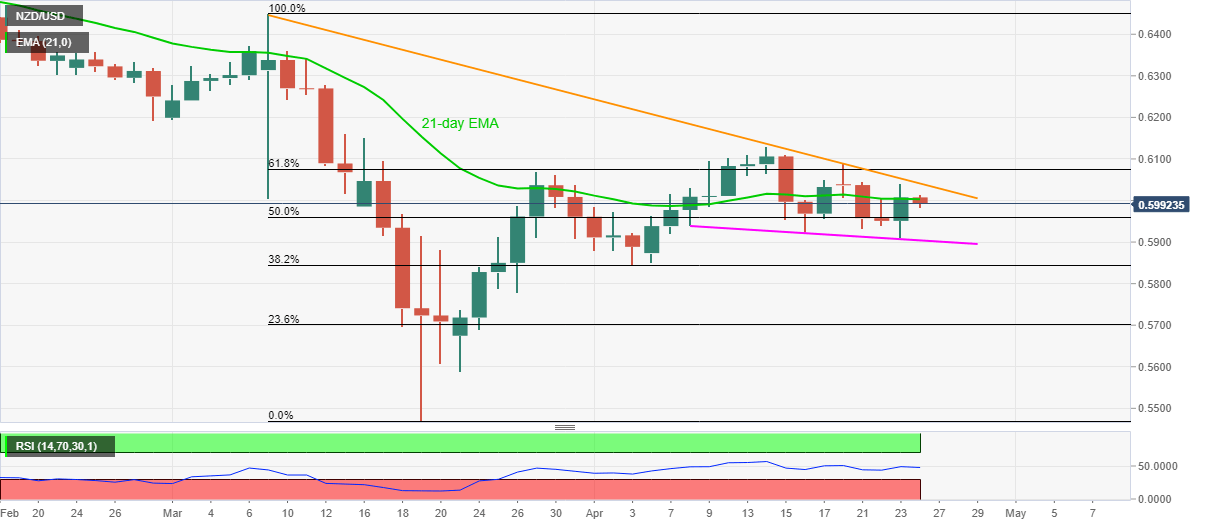
NZD/USD registers a 0.25% loss on a day ahead of the European session on Friday. The pair currently extends the pullback moves from 21-day EMA towards 50% Fibonacci retracement of March month downside.
Should sellers dominate past-0.5960 immediate support, a downward slopping trend line since April 08, presently around 0.5900, could restrict the pair’s further declines.
Meanwhile, the pair’s break above 21-day EMA level of 0.6005 will not be considered as a go-ahead signal for buyers due to the presence of a multi-day-old falling resistance line near 0.6040.
Additionally, bulls’ ability to cross 0.6040 on a daily closing basis will be checked by 61.8% Fibonacci retracement level of 0.6075 ahead of pushing then towards the monthly top near 0.6130.
NZD/USD daily chart
Trend: Pullback expected
Author

Anil Panchal
FXStreet
Anil Panchal has nearly 15 years of experience in tracking financial markets. With a keen interest in macroeconomics, Anil aptly tracks global news/updates and stays well-informed about the global financial moves and their implications.


