NZD/USD Price Analysis: Rises to near psychological barrier of 0.6100 ahead of 50-day EMA


  • NZD/USD moves in an upward trajectory despite the tepid momentum.
  • A break above the psychological barrier of 0.6100 level could lead the pair to revisit the weekly high at 0.6152.
  • The key support region appears at the major level of 0.6050 aligned with the weekly low at 0.6049.

NZD/USD extends its winning streak for the second successive day as the US Dollar demonstrates weakness due to subdued US Treasury yields. The NZD/USD pair edges higher to near 0.6090 during the European hours on Thursday.

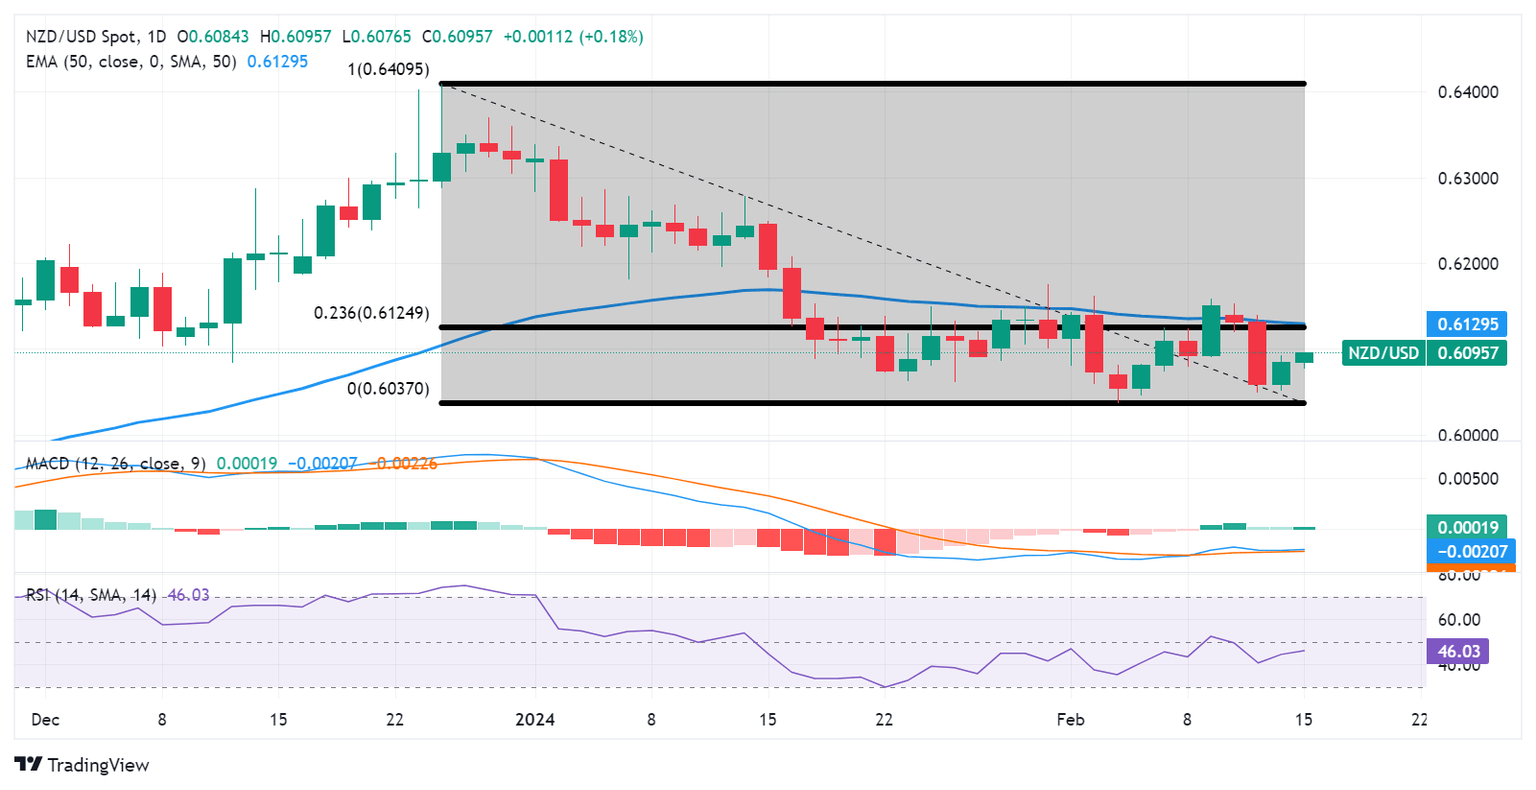
The immediate resistance appears at the psychological level of 0.6100. A breakthrough above this psychological level could inspire the NZD/USD pair to approach the resistance zone around the 23.6% Fibonacci retracement level of 0.6124 aligned with the 50-day Exponential Moving Average (EMA) at 0.6129.

If the NZD/USD pair surpasses this 50-day EMA, it could make it to the major barrier at 0.6150 in line with the weekly high at 0.6152.

The technical analysis for the NZD/USD pair indicates a tepid momentum in the market. The Moving Average Convergence Divergence (MACD) line is positioned below the centreline but lies above the signal line.

However, the lagging indicator 14-day Relative Strength Index (RSI) lies below the 50 level, suggesting a weaker sentiment for the NZD/USD pair.

On the downside, the NZD/USD pair could find key support at the major level of 0.6050 in conjunction with the weekly low at 0.6049. A break below the latter could put the downward pressure on the pair to navigate the region around February’s low at 0.6038 followed by the psychological support of 0.6000 level.

NZD/USD: Daily Chart

NZD/USD: more technical levels

Overview
Today last price 0.6092
Today Daily Change 0.0008
Today Daily Change % 0.13
Today daily open 0.6084
 
Trends
Daily SMA20 0.6103
Daily SMA50 0.6182
Daily SMA100 0.6075
Daily SMA200 0.608
 
Levels
Previous Daily High 0.6093
Previous Daily Low 0.6051
Previous Weekly High 0.6159
Previous Weekly Low 0.6037
Previous Monthly High 0.6339
Previous Monthly Low 0.6061
Daily Fibonacci 38.2% 0.6077
Daily Fibonacci 61.8% 0.6067
Daily Pivot Point S1 0.6059
Daily Pivot Point S2 0.6034
Daily Pivot Point S3 0.6017
Daily Pivot Point R1 0.6101
Daily Pivot Point R2 0.6118
Daily Pivot Point R3 0.6143


Share: Feed news

Information on these pages contains forward-looking statements that involve risks and uncertainties. Markets and instruments profiled on this page are for informational purposes only and should not in any way come across as a recommendation to buy or sell in these assets. You should do your own thorough research before making any investment decisions. FXStreet does not in any way guarantee that this information is free from mistakes, errors, or material misstatements. It also does not guarantee that this information is of a timely nature. Investing in Open Markets involves a great deal of risk, including the loss of all or a portion of your investment, as well as emotional distress. All risks, losses and costs associated with investing, including total loss of principal, are your responsibility. The views and opinions expressed in this article are those of the authors and do not necessarily reflect the official policy or position of FXStreet nor its advertisers. The author will not be held responsible for information that is found at the end of links posted on this page.

If not otherwise explicitly mentioned in the body of the article, at the time of writing, the author has no position in any stock mentioned in this article and no business relationship with any company mentioned. The author has not received compensation for writing this article, other than from FXStreet.

FXStreet and the author do not provide personalized recommendations. The author makes no representations as to the accuracy, completeness, or suitability of this information. FXStreet and the author will not be liable for any errors, omissions or any losses, injuries or damages arising from this information and its display or use. Errors and omissions excepted.

The author and FXStreet are not registered investment advisors and nothing in this article is intended to be investment advice.

Recommended content


Recommended content

Editors’ Picks

EUR/USD retreats from multi-week highs, holds above 1.0800

EUR/USD retreats from multi-week highs, holds above 1.0800

After climbing to its highest level in over a month above 1.0850 with the immediate reaction to the April inflation data from the US, EUR/USD erased a portion of its daily gains and declined below this level. The improvement seen in risk mood, however, helps the pair hold its ground.

EUR/USD News

GBP/USD clings to daily gains above 1.2600

GBP/USD clings to daily gains above 1.2600

GBP/USD pulled away from the monthly high it set above 1.2650 but managed to stabilize in positive territory above 1.2600. The US Dollar stays under modest bearish pressure as markets assess the underlying details of the inflation report and how they could influence the Fed's rate outlook.

GBP/USD News

Gold stays above $2,360 after US inflation report

Gold stays above $2,360 after US inflation report

Gold trades modestly higher on the day above $2,360 in the American session. The data from the US showed that annual inflation edged lower to 3.4% in April as expected. The benchmark 10-year US Treasury bond yield stays in the red below 4.4%, allowing XAU/USD to keep its footing.

Gold News

Ripple’s discounts for institutional clients stir debate among attorneys discussing SEC lawsuit

Ripple’s discounts for institutional clients stir debate among attorneys discussing SEC lawsuit

Ripple price consolidates in a tight range around $0.50 on Wednesday as the Securities and Exchange Commission (SEC) legal battle against payment-remittance firm Ripple intensifies with two key issues in focus this week. 

Read more

US inflation and Retail Sales data add to pressure on Fed to signal rate cut

US inflation and Retail Sales data add to pressure on Fed to signal rate cut

The US CPI report for April was mostly in line with expectations. The annual rate for headline price growth fell to 3.4% from 3.5%, while the core rate declined to 3.6% from 3.8%. 

Read more

Forex MAJORS

Cryptocurrencies

Signatures