NZD/USD Price Analysis: Retreats from over two-week high, holds above 0.5900 ahead of US data
- NZD/USD meets with a fresh supply on Tuesday amid a goodish pickup in the USD demand.
- Rejection near the ascending channel hurdle and the subsequent slide favors bearish traders.
- Investors now look to US macro data for some impetus ahead of NZ jobs data on Wednesday.

The NZD/USD pair comes under heavy selling pressure on Tuesday and moves away from over a two-week high, around the 0.5985 region touched the previous day. Spot prices remain depressed through the first half of the European session and currently trade near the lower end of the daily range, around the 0.5940 area amid a goodish pickup in the US Dollar (USD) demand.
Growing acceptance that the Federal Reserve (Fed) will begin its rate-cutting cycle only in September, along with a slightly softer risk tone, turn out to be key factors underpinning the safe-haven buck and weighing on the risk-sensitive Kiwi. Bulls, meanwhile, seem rather unimpressed by mixed Chinese PMI prints released earlier today as the focus remains squarely on the crucial FOMC decision, scheduled to be announced on Wednesday. In the meantime, the US macro data – the Chicago PMI and the Conference Board's Consumer Confidence Index – might provide some impetus ahead of the quarterly New Zealand employment details on Wednesday.
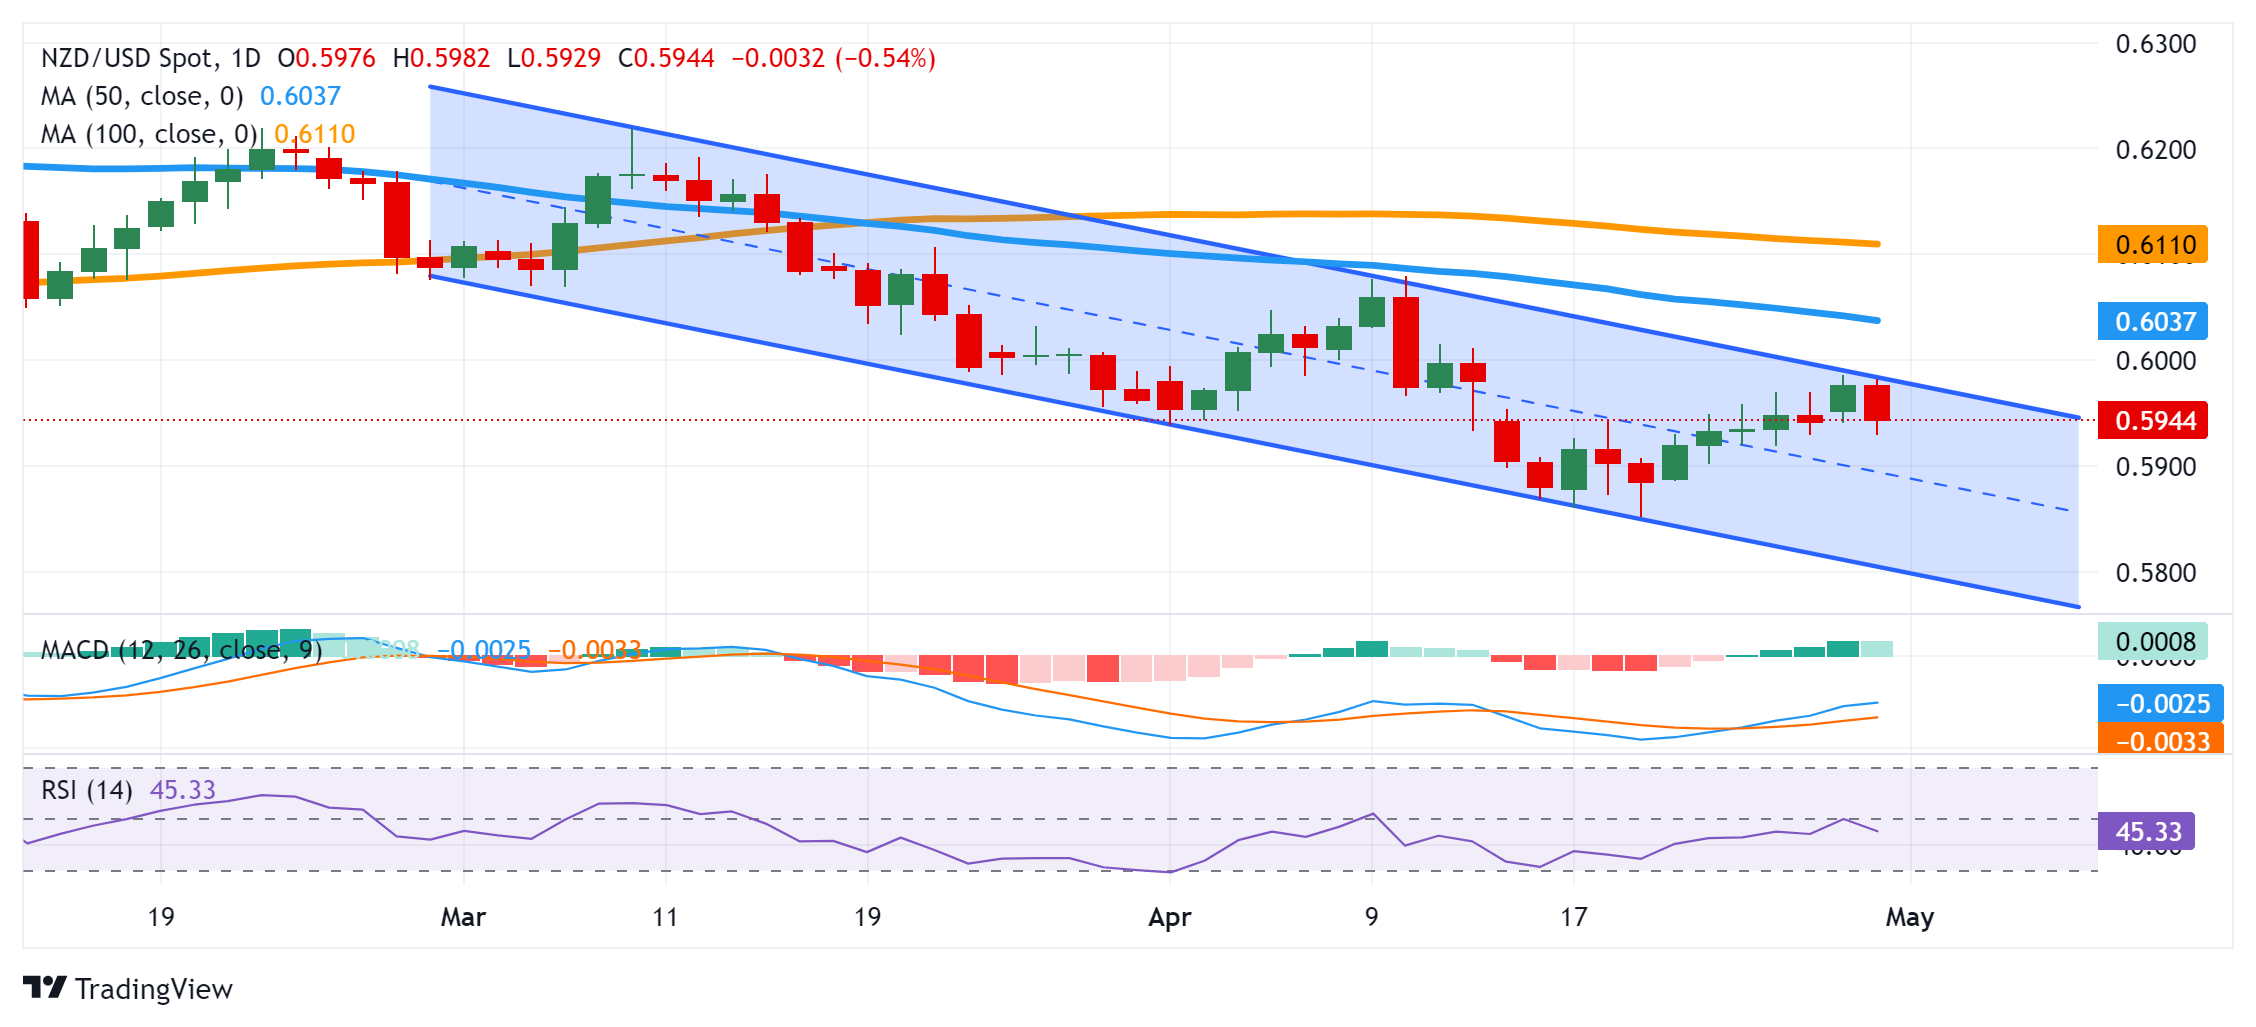
From a technical perspective, the recent recovery from the mid-0.5850 region, or the YTD low touched earlier this month, faced rejection near a resistance marked by the top boundary of a downward-sloping channel extending from early March. The said barrier is currently pegged near the 0.5980-0.5985 region and is closely followed by the 0.6000 psychological mark. A sustained strength beyond will suggest that the NZD/USD pair has bottomed out in the near term and pave the way for some meaningful upside. Spot prices might then aim to surpass the 50-day Simple Moving Average (SMA), around the 0.6040 area, and reclaim the 0.6100 mark.
On the flip side, any further decline is likely to find some support near the 0.5920 area ahead of the 0.5900 round figure. Failure to defend the latter might expose the YTD trough, around the 0.5850 region, before the NZD/USD pair eventually drops to challenge the descending channel support, currently pegged near the 0.5815-0.5810 region. This is followed by the 0.5800 mark, which if broken will be seen as a fresh trigger for bearish traders. That said, mixed oscillators on the daily chart warrant some caution before placing aggressive bets ahead of the key data/central bank event risks and positioning for any further depreciating move.
NZD/USD daily chart
Author

Haresh Menghani
FXStreet
Haresh Menghani is a detail-oriented professional with 10+ years of extensive experience in analysing the global financial markets.


