NZD/USD Price Analysis: Remains below 0.6000 as US Dollar sees more upside
- NZD/USD dips below 0.6000 as US Dollar strengthens after the release of the hot US Inflation data.
- Investors see the Fed to begin reducing interest rates from September, previously anticipated from June.
- The RBNZ delivered a hawkish guidance after keeping the OCR steady at 5.5%.

The NZD/USD pair finds a temporary cushion near 0.5966 in Thursday’s European session after falling vertically from the round-level resistance of 0.6100. The Kiwi asset is expected to deliver more losses as the US Dollar strengthens after expectations for the Federal Reserve (Fed) pivoting to rate cuts shifted to the September policy meeting from prior anticipation in June.
The US Dollar Index (DXY) jumps to more than four-month high above 105.00 as stronger-than-expected United States inflation data for March forces traders to unwind bets supporting rate cuts by the Fed. Also, traders’ anticipation for number of rate cuts by the Fed this year reduced to two from three projected by policymakers in the latest dot plot.
Meanwhile, investors shift focus to the US Producer Price Index (PPI) data for March, which will be published at 12:30 GMT. The annual headline PPI is forecasted to have grown strongly by 2.2% after increasing 1.6% in February. In the same period, annual core PPI that excludes volatile food and energy prices is anticipated to have risen sharply by 2.3% against the former reading of 2.0%.
On the Kiwi front, the Reserve Bank of New Zealand (RBNZ) kept its Official Cash Rate (OCR) unchanged at 5.5% for the sixth time in a row. The RBNZ delivered a hawkish guidance as annual price pressures at 4.7% are significantly higher than the desired range of 1-3%.
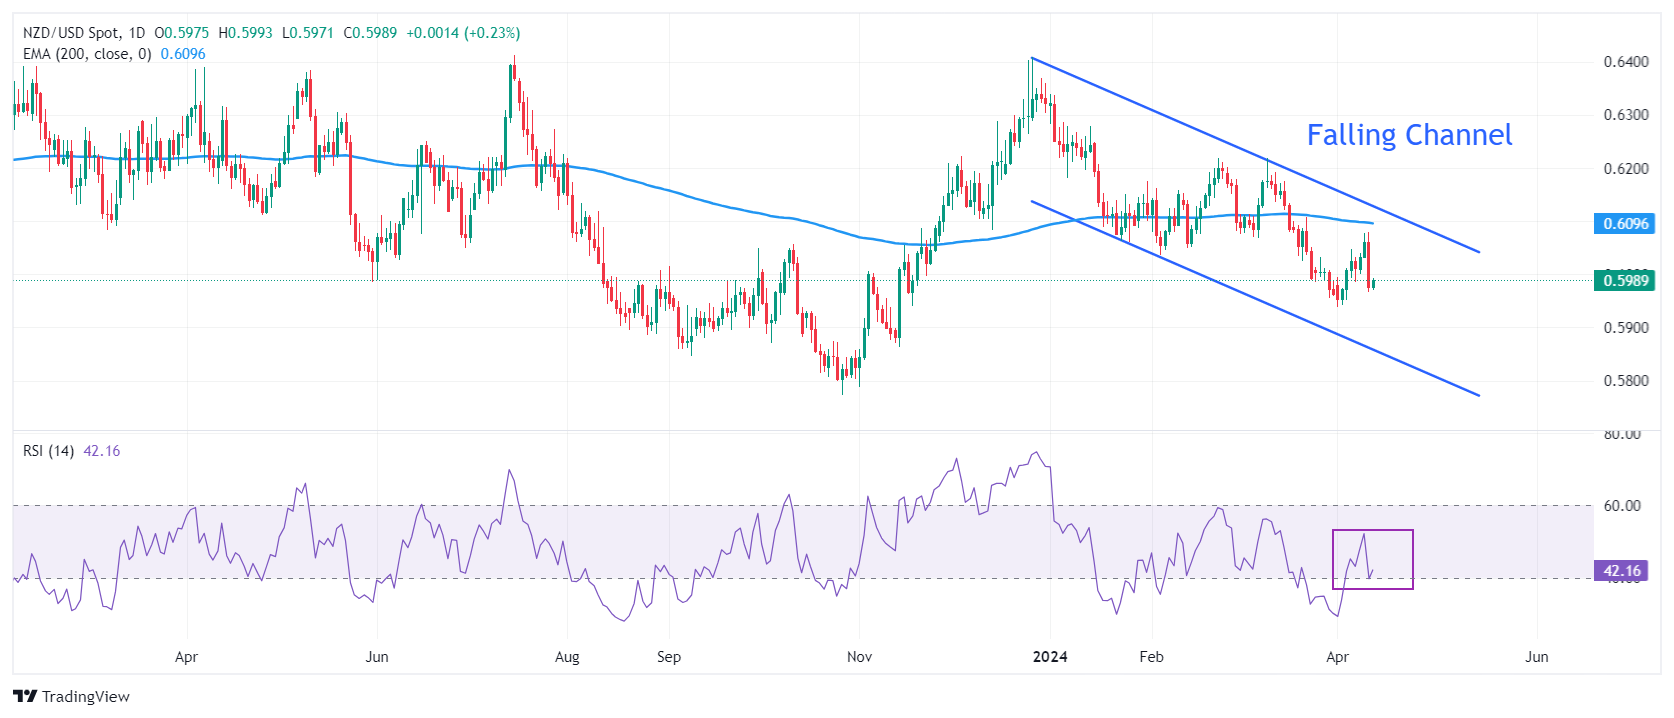
NZD/USD falls sharply while attempting to recapture the crucial resistance of 0.6100. The Kiwi asset trades in the Falling Channel chart pattern in which each pullback is considered as selling opportunity by the market participants. The long-term outlook of the Kiwi asset remains bearish as it trades below the 200-period Exponential Moving Average (EMA), which trades around 0.6100.
The 14-period Relative Strength Index (RSI) drops to 40.00. A bearish momentum would trigger if the RSI drops below the above-mentioned level.
Fresh downside would appear if the asset breaks below November 17 low at 0.5940. This would drag the asset toward the round-level support of 0.5900, followed by November 13 low at 0.587.
On the flip side, a recovery move above March 18 high at 0.6100 will drive the pair toward March 12 low at 0.6135. A breach of the latter will drive the asset further to February 9 high around 0.6160.
NZD/USD daily chart
Author

Sagar Dua
FXStreet
Sagar Dua is associated with the financial markets from his college days. Along with pursuing post-graduation in Commerce in 2014, he started his markets training with chart analysis.