|

NZD/USD Price Analysis: Prints cup-and-handle bullish formation around 0.7100

  • NZD/USD grinds higher following the pullback from weekly top.
  • Firmer RSI, sustained trading beyond 200-HMA favor bulls.
  • May’s top lures buyers during further upside, weekly low adds to the downside filters.

NZD/USD consolidates the heaviest daily gain in a week around 0.7195, down 0.11% intraday as European traders brace for Friday’s bell.

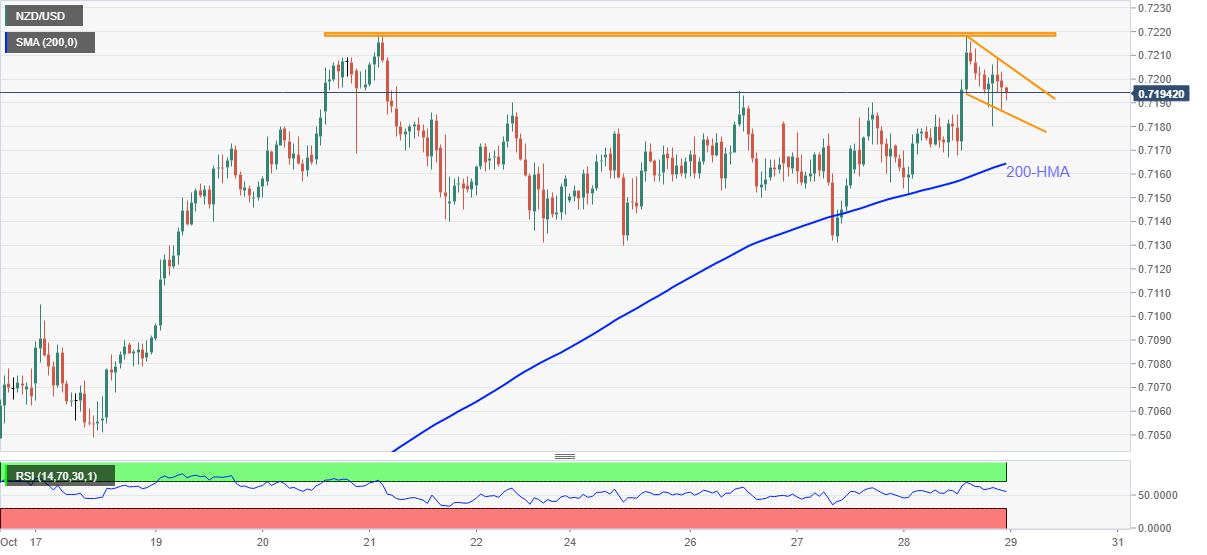
The kiwi pair poked the monthly high before easing from 0.7218 the previous day. In doing so, the quote portrays a cup-and-handle bullish chart pattern on the hourly play.

The buyer’s optimism could also be witnessed through the pair’s successful trading above 200-HMA amid a firmer RSI line.

However, a clear break of 0.7210, followed by the clearance to 0.7220, becomes necessary for the confirmation of an upside targeting May’s peak of 0.7317.

Meanwhile, pullback moves remain less worrisome until staying beyond the 200-HMA level of 0.7165. Also acting as immediate support is the area comprising multiple levels marked since October 22, around 0.7130.

To sum up, NZD/USD upside momentum is gradually catching heat but needs a trigger for fire.

 becomes necessary for the pair

NZD/USD: Hourly chart
Trend: Further upside expected

Additional important levels

Overview
Today last price0.7194
Today Daily Change-0.0008
Today Daily Change %-0.11%
Today daily open0.7202
 
Trends
Daily SMA200.7052
Daily SMA500.7038
Daily SMA1000.7019
Daily SMA2000.7101
 
Levels
Previous Daily High0.7218
Previous Daily Low0.7152
Previous Weekly High0.7219
Previous Weekly Low0.7049
Previous Monthly High0.7171
Previous Monthly Low0.6859
Daily Fibonacci 38.2%0.7193
Daily Fibonacci 61.8%0.7177
Daily Pivot Point S10.7163
Daily Pivot Point S20.7124
Daily Pivot Point S30.7097
Daily Pivot Point R10.7229
Daily Pivot Point R20.7257
Daily Pivot Point R30.7296

Author

Anil Panchal

Anil Panchal

FXStreet

Anil Panchal has nearly 15 years of experience in tracking financial markets. With a keen interest in macroeconomics, Anil aptly tracks global news/updates and stays well-informed about the global financial moves and their implications.


More from Anil Panchal
Share:

Editor's Picks

AUD/USD holds above 0.6950 as bullish USD caps gains

AUD/USD edges lower during the Asian session on Tuesday, stalling a two-day recovery move from a two-month low, touched last week. An extended rout in the fixed income market keeps US bond yields elevated near multi-year highs. This, along with geopolitical uncertainties, helps the US Dollar retain its bullish tone despite receding October Fed hike bets. However, expectations for another RBA rate hike this month could act as a tailwind for the Aussie.

USD/JPY rises back above 158.00 despite hawkish BoJ outlook

USD/JPY rises back above 158.00 in the early European morning on Tuesday. The pair strengthens as the Japanese Yen fails to find any inspiration from hawkish BoJ expectations and looming intervention risks. Meanwhile, geopolitical uncertainty and elevated US bond yields keep the US Dollar near its YTD high despite receding October Fed hike bets. This, in turn, helps the pair stay supported.

Gold trades with modest gains; still below $4,200

Gold builds on Monday’s marginal bounce, although it struggles to reclaim the key $4,200 mark per troy ounce on Tuesday. The yellow metal’s advance comes on the back of the fresh downside momentum in the US Dollar in tandem with retreating US Treasury yields across the curve.

Crypto Today: Bitcoin, Ethereum, XRP bulls battle to restart uptrend amid ETF outflows

Bitcoin upholds a robust bullish outlook, trading at $85,837 on Tuesday as sellers push to regain control over the trend. Altcoins, meanwhile, reflect Bitcoin’s ranging action, with Ethereum trading sideways above $2,700 and Ripple hovering around the pivotal $1.50 level.

Japanese Yen nears 158.00: Two analysts agree it's bullish, and disagree on how far the breakout goes

The JPY is drifting near 158.00 against the USD ahead of a busy week of Japanese data and a still-unclear BoJ timetable. The two most recent FXStreet analyses agree on the direction, but they disagree on the target and the mechanism.

Eurozone inflation just hit 3.8%, its highest in three years. This chart shows why the ECB can’t simply hike its way out

The ECB would normally have a relatively straightforward answer to inflation running almost twice its target: raise interest rates. But these are not normal circumstances. This time, the bond market is already doing part of the tightening for it, leaving the ECB facing an increasingly difficult dilemma.















