NZD/USD Price Analysis: Pares RBNZ-inspired gains below 0.6200 as Governor Orr utters recession


  • NZD/USD fades upside momentum inside one-week-old trading range.
  • RBNZ announced 75 bps rate hike, Governor Orr expects shallow recession.
  • Bulls remain hopeful as convergence of the six-week-old ascending trend line, 200-EMA appears a tough nut to crack for sellers.
  • Late August high could lure buyers past 0.6206.

NZD/USD retreats from intraday high surrounding 0.6200 to 0.6166 during early Wednesday as bulls run out of steam on the latest commentary from Reserve Bank of New Zealand (RBNZ) Governor Adrian Orr.

Also read: RBNZ’s Orr: It will be a brief recession

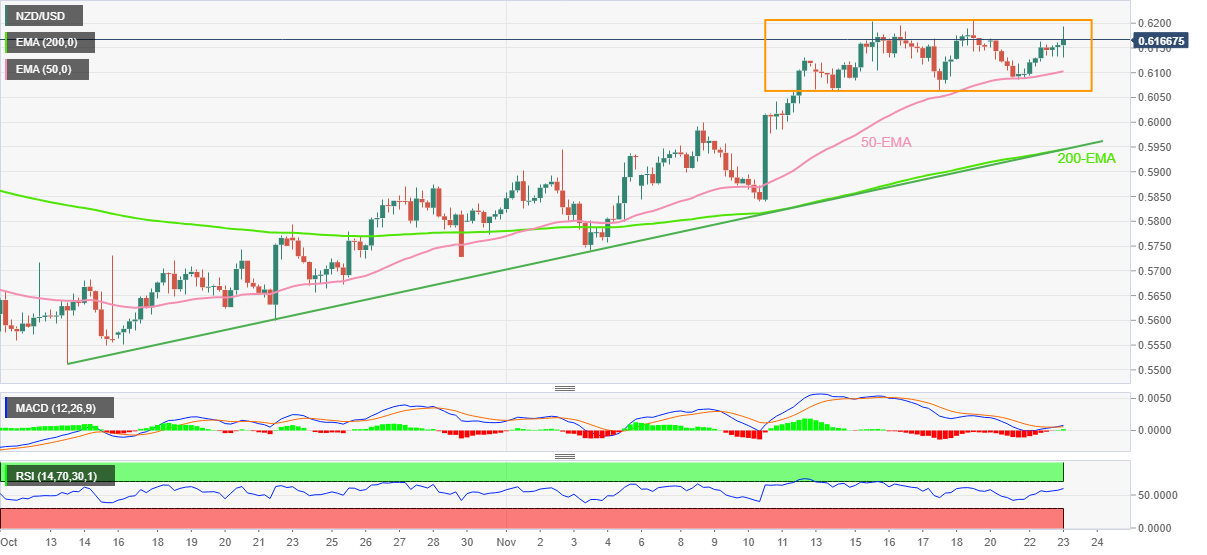
Even so, the Kiwi pair remains inside an eight-day-long symmetrical formation and keeps the buyers hopeful.

Also suggesting the NZD/USD pair’s further upside are the bullish signals from the Moving Average Convergence and Divergence (MACD) indicator, as well as the steady Relative Strength Index (RSI) placed at 14.

That said, the 50-EMA level surrounding 0.6100 offers immediate support to the quote ahead of the aforementioned trading range’s bottom, near 0.6060.

Following that, the 200-EMA and an upward-sloping trend line from October 10, close to 0.5945, becomes crucial for NZD/USD sellers to retake control.

Alternatively, an upside clearance of 0.6206 could direct the pair buyers toward the late August high surrounding 0.6255.

However, the NZD/USD pair’s successful run-up beyond 0.6255 will enable the bulls to aim for the August month’s peak near 0.6470.

NZD/USD: Four-hour chart

Trend: Further upside expected

Additional important levels

Overview
Today last price 0.6167
Today Daily Change 0.0015
Today Daily Change % 0.24%
 
Trends
Daily SMA20 0.5972
Daily SMA50 0.5827
Daily SMA100 0.6017
Daily SMA200 0.6307
 
Levels
Previous Daily High 0.6163
Previous Daily Low 0.6093
Previous Weekly High 0.6206
Previous Weekly Low 0.6062
Previous Monthly High 0.5874
Previous Monthly Low 0.5512
Daily Fibonacci 38.2% 0.6136
Daily Fibonacci 61.8% 0.612
Daily Pivot Point S1 0.611
Daily Pivot Point S2 0.6067
Daily Pivot Point S3 0.604
Daily Pivot Point R1 0.6179
Daily Pivot Point R2 0.6206
Daily Pivot Point R3 0.6249


Share: Feed news

Information on these pages contains forward-looking statements that involve risks and uncertainties. Markets and instruments profiled on this page are for informational purposes only and should not in any way come across as a recommendation to buy or sell in these assets. You should do your own thorough research before making any investment decisions. FXStreet does not in any way guarantee that this information is free from mistakes, errors, or material misstatements. It also does not guarantee that this information is of a timely nature. Investing in Open Markets involves a great deal of risk, including the loss of all or a portion of your investment, as well as emotional distress. All risks, losses and costs associated with investing, including total loss of principal, are your responsibility. The views and opinions expressed in this article are those of the authors and do not necessarily reflect the official policy or position of FXStreet nor its advertisers. The author will not be held responsible for information that is found at the end of links posted on this page.

If not otherwise explicitly mentioned in the body of the article, at the time of writing, the author has no position in any stock mentioned in this article and no business relationship with any company mentioned. The author has not received compensation for writing this article, other than from FXStreet.

FXStreet and the author do not provide personalized recommendations. The author makes no representations as to the accuracy, completeness, or suitability of this information. FXStreet and the author will not be liable for any errors, omissions or any losses, injuries or damages arising from this information and its display or use. Errors and omissions excepted.

The author and FXStreet are not registered investment advisors and nothing in this article is intended to be investment advice.

Recommended content


Recommended content

Editors’ Picks

USD/JPY jumps above 156.00 on BoJ's steady policy

USD/JPY jumps above 156.00 on BoJ's steady policy

USD/JPY has come under intense buying pressure, surging past 156.00 after the Bank of Japan kept the key rate unchanged but tweaked its policy statement. The BoJ maintained its fiscal year 2024 and 2025 inflation forecast, disappointing the Japanese Yen buyers. 

USD/JPY News

AUD/USD consolidates gains above 0.6500 after Australian PPI data

AUD/USD consolidates gains above 0.6500 after Australian PPI data

AUD/USD is consolidating gains above 0.6500 in Asian trading on Friday. The pair capitalizes on an annual increase in Australian PPI data. Meanwhile, a softer US Dollar and improving market mood also underpin the Aussie ahead of the US PCE inflation data. 

AUD/USD News

Gold price keeps its range around $2,330, awaits US PCE data

Gold price keeps its range around $2,330, awaits US PCE data

Gold price is consolidating Thursday's rebound early Friday. Gold price jumped after US GDP figures for the first quarter of 2024 missed estimates, increasing speculation that the Fed could lower borrowing costs. Focus shifts to US PCE inflation on Friday. 

Gold News

Stripe looks to bring back crypto payments as stablecoin market cap hits all-time high

Stripe looks to bring back crypto payments as stablecoin market cap hits all-time high

Stripe announced on Thursday that it would add support for USDC stablecoin, as the stablecoin market exploded in March, according to reports by Cryptocompare.

Read more

US economy: Slower growth with stronger inflation

US economy: Slower growth with stronger inflation

The US Dollar strengthened, and stocks fell after statistical data from the US. The focus was on the preliminary estimate of GDP for the first quarter. Annualised quarterly growth came in at just 1.6%, down from the 2.5% and 3.4% previously forecast.

Read more

Forex MAJORS

Cryptocurrencies

Signatures