NZD/USD Price Analysis: Limited upside potential after the bullish surpass of 0.6200


  • NZD/USD grinds higher around intraday top, stays firmer past the key supports.
  • Upbeat MACD, RSI signals hint at the Kiwi pair’s further run-up.
  • One-month-old horizontal resistance area challenges bulls; 200-DMA restricts immediate downside.

NZD/USD seesaws around intraday high near 0.6210, up 0.40% on a day, as bulls cheer the previous day’s inability to conquer the 200-DMA support amid early Tuesday. In doing so, the Kiwi pair buyers also benefit from the upbeat oscillators while heading into a short-term key resistance.

A looming bullish cross on the MACD joins the RSI (14) rebound towards the 50 line to underpin the hopes of the NZD/USD pair’s further recovery.

However, a horizontal area comprising multiple levels marked since early February, near 0.6270-75, appears a tough nut to crack for the Kiwi pair buyers to cross for conviction.

Following that, a run-up towards the mid-February swing high near 0.6390, quickly followed by the 0.6400 threshold, can’t be ruled out.

On the flip side, the 200-DMA support level of 0.6165 restricts short-term declines of the NZD/USD pair.

Even if the Kiwi prices drop below 0.6165 DMA support, the previous resistance line from early February, near 0.6130 at the latest, could challenge the bears. It’s worth noting that the 0.6130 level also becomes important as it encompasses the previous monthly low.

Should the NZD/USD bears remains weak past 0.6130, the odds of witnessing a slump toward the mid-November 2022 low near 0.6060 can’t be ruled out.

NZD/USD: Daily chart
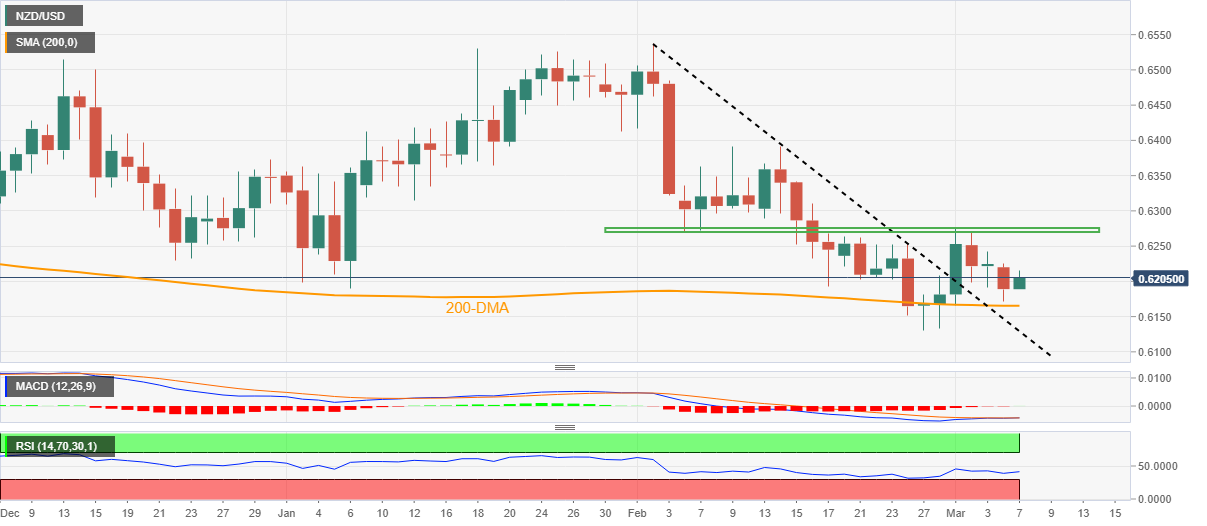
Trend: Sideways

Additional important levels

Overview
Today last price 0.6205
Today Daily Change 0.0016
Today Daily Change % 0.26%
Today daily open 0.6189
 
Trends
Daily SMA20 0.6253
Daily SMA50 0.6336
Daily SMA100 0.6223
Daily SMA200 0.6176
 
Levels
Previous Daily High 0.6226
Previous Daily Low 0.6172
Previous Weekly High 0.6277
Previous Weekly Low 0.6131
Previous Monthly High 0.6538
Previous Monthly Low 0.6131
Daily Fibonacci 38.2% 0.6193
Daily Fibonacci 61.8% 0.6205
Daily Pivot Point S1 0.6165
Daily Pivot Point S2 0.6142
Daily Pivot Point S3 0.6111
Daily Pivot Point R1 0.6219
Daily Pivot Point R2 0.625
Daily Pivot Point R3 0.6273


Share: Feed news

Information on these pages contains forward-looking statements that involve risks and uncertainties. Markets and instruments profiled on this page are for informational purposes only and should not in any way come across as a recommendation to buy or sell in these assets. You should do your own thorough research before making any investment decisions. FXStreet does not in any way guarantee that this information is free from mistakes, errors, or material misstatements. It also does not guarantee that this information is of a timely nature. Investing in Open Markets involves a great deal of risk, including the loss of all or a portion of your investment, as well as emotional distress. All risks, losses and costs associated with investing, including total loss of principal, are your responsibility. The views and opinions expressed in this article are those of the authors and do not necessarily reflect the official policy or position of FXStreet nor its advertisers. The author will not be held responsible for information that is found at the end of links posted on this page.

If not otherwise explicitly mentioned in the body of the article, at the time of writing, the author has no position in any stock mentioned in this article and no business relationship with any company mentioned. The author has not received compensation for writing this article, other than from FXStreet.

FXStreet and the author do not provide personalized recommendations. The author makes no representations as to the accuracy, completeness, or suitability of this information. FXStreet and the author will not be liable for any errors, omissions or any losses, injuries or damages arising from this information and its display or use. Errors and omissions excepted.

The author and FXStreet are not registered investment advisors and nothing in this article is intended to be investment advice.

Recommended content


Recommended content

Editors’ Picks

EUR/USD edges lower toward 1.0700 post-US PCE

EUR/USD edges lower toward 1.0700 post-US PCE

EUR/USD stays under modest bearish pressure but manages to hold above 1.0700 in the American session on Friday. The US Dollar (USD) gathers strength against its rivals after the stronger-than-forecast PCE inflation data, not allowing the pair to gain traction.

EUR/USD News

GBP/USD retreats to 1.2500 on renewed USD strength

GBP/USD retreats to 1.2500 on renewed USD strength

GBP/USD lost its traction and turned negative on the day near 1.2500. Following the stronger-than-expected PCE inflation readings from the US, the USD stays resilient and makes it difficult for the pair to gather recovery momentum.

GBP/USD News

Gold struggles to hold above $2,350 following US inflation

Gold struggles to hold above $2,350 following US inflation

Gold turned south and declined toward $2,340, erasing a large portion of its daily gains, as the USD benefited from PCE inflation data. The benchmark 10-year US yield, however, stays in negative territory and helps XAU/USD limit its losses. 

Gold News

Bitcoin Weekly Forecast: BTC’s next breakout could propel it to $80,000 Premium

Bitcoin Weekly Forecast: BTC’s next breakout could propel it to $80,000

Bitcoin’s recent price consolidation could be nearing its end as technical indicators and on-chain metrics suggest a potential upward breakout. However, this move would not be straightforward and could punish impatient investors. 

Read more

Week ahead – Hawkish risk as Fed and NFP on tap, Eurozone data eyed too

Week ahead – Hawkish risk as Fed and NFP on tap, Eurozone data eyed too

Fed meets on Wednesday as US inflation stays elevated. Will Friday’s jobs report bring relief or more angst for the markets? Eurozone flash GDP and CPI numbers in focus for the Euro.

Read more

Forex MAJORS

Cryptocurrencies

Signatures