|

NZD/USD Price Analysis: Grinds lower within rising wedge on softer China PMI, 0.6210 eyed

  • NZD/USD stays defensive as it attacks short-term key support confluence inside bearish chart formation.
  • China PMIs drop in March, NZIER hints at 0.25% RBNZ rate hike.
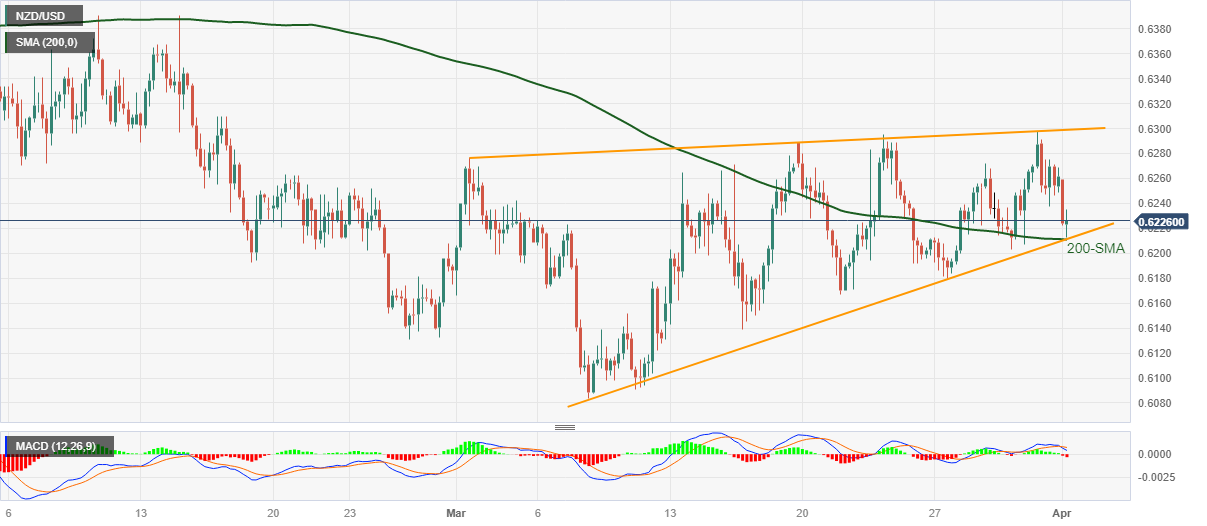
  • 200-SMA, rising wedge’s support line challenge sellers even as bearish MACD signals keep them hopeful.
  • Bulls need successful break of 0.6300 to retake control.

NZD/USD grinds near the intraday low surrounding 0.6210 as bears attack a short-term key support confluence on downbeat China data during early Monday.

That said, China’s Caixin Manufacturing PMI for March drops to 50.0 from 51.6 prior and 51.7 market forecasts.

Not only downbeat China PMIs but hopes of a dovish hike from the Reserve Bank of New Zealand (RBNZ), signaled by the latest New Zealand Institute of Economic Research (NZIER) report, also exert downside pressure on the NZD/USD prices.

With this, the Kiwi pair pokes a convergence of the 200-bar SMA and lower line of a one-month-old rising wedge bearish chart pattern. Adding strength to the downside bias are the bearish MACD signals.

Hence, the quote is likely to break the 0.6210 nearby support, which in turn opens the door for the NZD/USD pair’s theoretical slump towards the 0.6000 psychological magnet. However, multiple levels around 0.6140, the 0.6100 round figure and the previous monthly low of 0.6085 can test the Kiwi pair sellers between 0.6210 and 0.6000.

On the contrary, recovery moves may initially aim for 0.6270 hurdle before poking the stated wedge’s top line surrounding 0.6295.

However, the recent swing high around the 0.6300 round figure can act as the last defense of the NZD/USD bears before directing the quote towards the double tops marked in February around 0.6390.

NZD/USD: Four-hour chart

Trend: Further downside expected

Additional important levels

Overview
Today last price0.6227
Today Daily Change-0.0034
Today Daily Change %-0.54%
Today daily open0.6261
 
Trends
Daily SMA200.6204
Daily SMA500.6279
Daily SMA1000.6295
Daily SMA2000.6159
 
Levels
Previous Daily High0.6298
Previous Daily Low0.6237
Previous Weekly High0.6298
Previous Weekly Low0.618
Previous Monthly High0.6298
Previous Monthly Low0.6084
Daily Fibonacci 38.2%0.6261
Daily Fibonacci 61.8%0.6275
Daily Pivot Point S10.6233
Daily Pivot Point S20.6205
Daily Pivot Point S30.6173
Daily Pivot Point R10.6294
Daily Pivot Point R20.6326
Daily Pivot Point R30.6354

Author

Anil Panchal

Anil Panchal

FXStreet

Anil Panchal has nearly 15 years of experience in tracking financial markets. With a keen interest in macroeconomics, Anil aptly tracks global news/updates and stays well-informed about the global financial moves and their implications.

More from Anil Panchal
Share:

Markets move fast. We move first.

Orange Juice Newsletter brings you expert driven insights - not headlines. Every day on your inbox.

By subscribing you agree to our Terms and conditions.

Editor's Picks

EUR/USD struggles to extend advance above 1.1800

The EUR/USD pair posts a fresh weekly low near 1.1740 during the Asian trading session on Wednesday. The major currency pair is under pressure as the US Dollar edges higher despite Federal Open Market Committee minutes of the December policy meeting, released on Tuesday, showing that most policymakers stressed the need for further interest rate cuts.

GBP/USD tests 1.3450 support after moving below nine-day EMA

GBP/USD remains subdued for the second consecutive day, trading around 1.3460 during the Asian hours on Wednesday. The technical analysis of the daily chart indicates a weakening of a bullish bias as the pair is positioned slightly below the lower boundary of the ascending channel pattern.

Gold jumps on US rate cut prospects, safe-haven demand

Gold price extends the rally above $4,350 during the early European trading hours on Wednesday. Gold's price has surged about 65% this year and is set to record its biggest annual gains since 1979. The rally in the precious metal is bolstered by the prospect of further US interest rate cuts in 2026. Lower interest rates could reduce the opportunity cost of holding Gold, supporting the non-yielding precious metal.

Bitcoin, Ethereum and XRP prepare for a potential New Year rebound

Bitcoin, Ethereum, and Ripple are holding steady on Wednesday after recording minor gains on the previous day. Technically, Bitcoin could extend gains within a triangle pattern while Ethereum and Ripple face critical overhead resistance. 

Economic outlook 2026-2027 in advanced countries: Solidity test

After a year marked by global economic resilience and ending on a note of optimism, 2026 looks promising and could be a year of solid economic performance. In our baseline scenario, we expect most of the supportive factors at work in 2025 to continue to play a role in 2026.

Crypto market outlook for 2026

Year 2025 was volatile, as crypto often is.  Among positive catalysts were favourable regulatory changes in the U.S., rise of Digital Asset Treasuries (DAT), adoption of AI and tokenization of Real-World-Assets (RWA).