NZD/USD Price Analysis: Focus remains on 0.6800-6790 key support following China PMI


  • NZD/USD struggles to defend Monday’s bounce off crucial support zone.
  • China’s NBS Manufacturing PMI jumps back into expansion territory but Non-Manufacturing PMI eases in November.
  • Sustained trading below 17-month-old trend line, bearish MACD signals favor sellers.
  • Bulls need validation from 50% Fibonacci retracement, March’s low.

NZD/USD prints mild gains around 0.6820 amid early Tuesday, following the rebound from important support the previous day.

Pair’s recent gains could be linked to cautious optimism in the market and mixed data from the largest customer China. That said, the headline NBS Manufacturing PMI jumped back to expansion territory with above 50.0 numbers for the first time in three months but Non-Manufacturing PMI eased below market consensus and prior readouts during November. Following the data release, China says, “Economic mood is improving as 3 PMIs show expansion.”

Read: China's November official Manufacturing PMI back in expansion

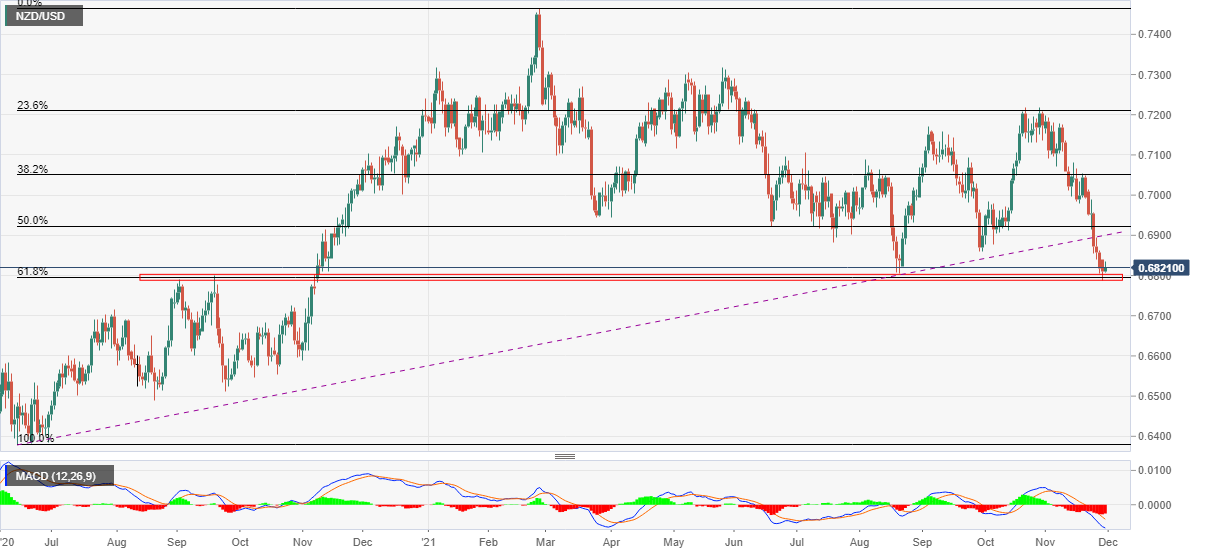
Technically, bears cheer a sustained trading below the 17-month-old support line, now resistance around 0.6900. However, the 61.8% Fibonacci retracement (Fibo.) level of June 2020 to February 2021 upside and multiple levels marked during September and November 2020 provide a tough nut to crack for the bears around 0.6800-6790 area.

Should the kiwi sellers successfully conquer 0.6790 support, October 2020 peak surrounding 0.6725 should return to the charts.

Alternatively, September 2021 bottom close to 0.6860 may initially probe the pair’s corrective pullback before the aforementioned support-turned-resistance line around 0.6900.

Adding to the upside filters is the 50% Fibo. and March’s low, respectively near 0.6925 and 0.6945.

NZD/USD: Daily chart

Trend: Further weakness expected

Additional important levels

Overview
Today last price 0.6822
Today Daily Change 0.0013
Today Daily Change % 0.19%
Today daily open 0.6809
 
Trends
Daily SMA20 0.7012
Daily SMA50 0.703
Daily SMA100 0.702
Daily SMA200 0.7081
 
Levels
Previous Daily High 0.684
Previous Daily Low 0.6787
Previous Weekly High 0.7014
Previous Weekly Low 0.6804
Previous Monthly High 0.7219
Previous Monthly Low 0.6876
Daily Fibonacci 38.2% 0.6807
Daily Fibonacci 61.8% 0.682
Daily Pivot Point S1 0.6784
Daily Pivot Point S2 0.6759
Daily Pivot Point S3 0.6731
Daily Pivot Point R1 0.6837
Daily Pivot Point R2 0.6865
Daily Pivot Point R3 0.689


Share: Feed news

Information on these pages contains forward-looking statements that involve risks and uncertainties. Markets and instruments profiled on this page are for informational purposes only and should not in any way come across as a recommendation to buy or sell in these assets. You should do your own thorough research before making any investment decisions. FXStreet does not in any way guarantee that this information is free from mistakes, errors, or material misstatements. It also does not guarantee that this information is of a timely nature. Investing in Open Markets involves a great deal of risk, including the loss of all or a portion of your investment, as well as emotional distress. All risks, losses and costs associated with investing, including total loss of principal, are your responsibility. The views and opinions expressed in this article are those of the authors and do not necessarily reflect the official policy or position of FXStreet nor its advertisers. The author will not be held responsible for information that is found at the end of links posted on this page.

If not otherwise explicitly mentioned in the body of the article, at the time of writing, the author has no position in any stock mentioned in this article and no business relationship with any company mentioned. The author has not received compensation for writing this article, other than from FXStreet.

FXStreet and the author do not provide personalized recommendations. The author makes no representations as to the accuracy, completeness, or suitability of this information. FXStreet and the author will not be liable for any errors, omissions or any losses, injuries or damages arising from this information and its display or use. Errors and omissions excepted.

The author and FXStreet are not registered investment advisors and nothing in this article is intended to be investment advice.

Recommended content


Recommended content

Editors’ Picks

EUR/USD holds below 1.0750 ahead of key US data

EUR/USD holds below 1.0750 ahead of key US data

EUR/USD trades in a tight range below 1.0750 in the European session on Friday. The US Dollar struggles to gather strength ahead of key PCE Price Index data, the Fed's preferred gauge of inflation, and helps the pair hold its ground. 

EUR/USD News

GBP/USD consolidates above 1.2500, eyes on US PCE data

GBP/USD consolidates above 1.2500, eyes on US PCE data

GBP/USD fluctuates at around 1.2500 in the European session on Friday following the three-day rebound. The PCE inflation data for March will be watched closely by market participants later in the day.

GBP/USD News

Gold clings to modest daily gains at around $2,350

Gold clings to modest daily gains at around $2,350

Gold stays in positive territory at around $2,350 after closing in positive territory on Thursday. The benchmark 10-year US Treasury bond yield edges lower ahead of US PCE Price Index data, allowing XAU/USD to stretch higher.

Gold News

Bitcoin Weekly Forecast: BTC’s next breakout could propel it to $80,000 Premium

Bitcoin Weekly Forecast: BTC’s next breakout could propel it to $80,000

Bitcoin’s recent price consolidation could be nearing its end as technical indicators and on-chain metrics suggest a potential upward breakout. However, this move would not be straightforward and could punish impatient investors. 

Read more

US core PCE inflation set to signal firm price pressures as markets delay Federal Reserve rate cut bets

US core PCE inflation set to signal firm price pressures as markets delay Federal Reserve rate cut bets

The core PCE Price Index, which excludes volatile food and energy prices, is seen as the more influential measure of inflation in terms of Fed positioning. The index is forecast to rise 0.3% on a monthly basis in March, matching February’s increase. 

Read more

Forex MAJORS

Cryptocurrencies

Signatures