NZD/USD Price Analysis: Extends above 0.6060 as US borrowing cap increase approval weighs on US Dollar


  • NZD/USD has stretched its recovery above 0.6060 amid a sheer sell-off in the USD Index.
  • An increase in $31.4 trillion US borrowing limit is expected to attract downgrades from credit rating firms for US long-term sovereignty.
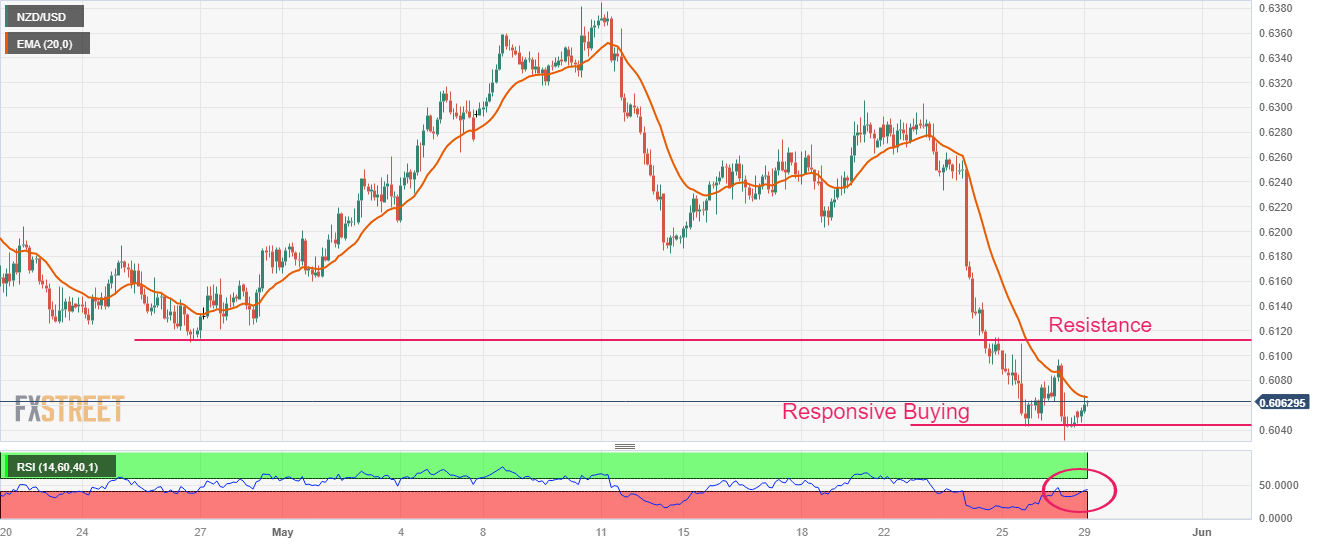
  • NZD/USD has shown a responsive buying move after dropping below 0.6040 but is likely to face stiff barricades around 0.6110.

The NZD/USD pair has extended its recovery above 0.6060 in the Asian session. The Kiwi asset is expected to stretch its rebound move further as the approval for the US debt-ceiling raise has weighed heavily on the US Dollar Index (DXY).

Gains in the S&P500 futures have trimmed sharply after the approval of the raise in the US debt-ceiling. An increase in the $31.4 trillion US borrowing limit is expected to attract downgrades from credit rating firms for US long-term sovereignty. This will weigh heavily on the US Dollar Index and US equities ahead.

On a broader note, the New Zealand Dollar remained under pressure despite the Reserve Bank of New Zealand (RBNZ) hiked interest rates by 25 basis points (bps) last week to 5.50%. RBNZ Assistant Governor Karen Silk warned that the central bank must be watchful of over-tightening policy and that it can hold now and sees what develops.

NZD/USD has shown a responsive buying move after dropping below 0.6040 on a two-hour scale. The recovery move by the Kiwi asset has to pass through plenty of filters to build a bullish impression. The recovery move in the Kiwi asset is expected to face stiff barricades around the horizontal resistance plotted from April 26 low at 0.6110.

The 20-period Exponential Moving Average (EMA) at 0.6067 is still acting as a barricade for the New Zealand Dollar bulls.

Meanwhile, the Relative Strength Index (RSI) (14) has attempted a range shift into the 40.00-60.00 territory from the bearish range of 20.00-40.00, which indicates a loss in the downside momentum.

Further extension in recovery above April 26 low at 0.6110 will push the Kiwi asset toward April 27 high at 0.6162 followed by May 12 low at 0.6182.

On the contrary, a downside move below May 26 low at 0.6032 will expose the asset to a fresh six-month low toward the psychological support of 0.6000. A slippage below the latter will further drag the asset toward 11 November 2022 low at 0.5984.

NZD/USD two-hour chart

NZD/USD

Overview
Today last price 0.6062
Today Daily Change 0.0016
Today Daily Change % 0.26
Today daily open 0.6046
 
TrendS
Daily SMA20 0.6226
Daily SMA50 0.6221
Daily SMA100 0.6267
Daily SMA200 0.6153
 
Levels
Previous Daily High 0.6097
Previous Daily Low 0.6032
Previous Weekly High 0.6303
Previous Weekly Low 0.6032
Previous Monthly High 0.6389
Previous Monthly Low 0.6111
Daily Fibonacci 38.2% 0.6057
Daily Fibonacci 61.8% 0.6072
Daily Pivot Point S1 0.602
Daily Pivot Point S2 0.5993
Daily Pivot Point S3 0.5955
Daily Pivot Point R1 0.6085
Daily Pivot Point R2 0.6123
Daily Pivot Point R3 0.615


Share: Feed news

Information on these pages contains forward-looking statements that involve risks and uncertainties. Markets and instruments profiled on this page are for informational purposes only and should not in any way come across as a recommendation to buy or sell in these assets. You should do your own thorough research before making any investment decisions. FXStreet does not in any way guarantee that this information is free from mistakes, errors, or material misstatements. It also does not guarantee that this information is of a timely nature. Investing in Open Markets involves a great deal of risk, including the loss of all or a portion of your investment, as well as emotional distress. All risks, losses and costs associated with investing, including total loss of principal, are your responsibility. The views and opinions expressed in this article are those of the authors and do not necessarily reflect the official policy or position of FXStreet nor its advertisers. The author will not be held responsible for information that is found at the end of links posted on this page.

If not otherwise explicitly mentioned in the body of the article, at the time of writing, the author has no position in any stock mentioned in this article and no business relationship with any company mentioned. The author has not received compensation for writing this article, other than from FXStreet.

FXStreet and the author do not provide personalized recommendations. The author makes no representations as to the accuracy, completeness, or suitability of this information. FXStreet and the author will not be liable for any errors, omissions or any losses, injuries or damages arising from this information and its display or use. Errors and omissions excepted.

The author and FXStreet are not registered investment advisors and nothing in this article is intended to be investment advice.

Recommended content


Recommended content

Editors’ Picks

EUR/USD trades with negative bias, holds above 1.0700 as traders await US PCE Price Index

EUR/USD trades with negative bias, holds above 1.0700 as traders await US PCE Price Index

EUR/USD edges lower during the Asian session on Friday and moves away from a two-week high, around the 1.0740 area touched the previous day. Spot prices trade around the 1.0725-1.0720 region and remain at the mercy of the US Dollar price dynamics ahead of the crucial US data.

EUR/USD News

USD/JPY jumps above 156.00 on BoJ's steady policy

USD/JPY jumps above 156.00 on BoJ's steady policy

USD/JPY has come under intense buying pressure, surging past 156.00 after the Bank of Japan kept the key rate unchanged but tweaked its policy statement. The BoJ maintained its fiscal year 2024 and 2025 core inflation forecasts, disappointing the Japanese Yen buyers. 

USD/JPY News

Gold price flatlines as traders look to US PCE Price Index for some meaningful impetus

Gold price flatlines as traders look to US PCE Price Index for some meaningful impetus

Gold price lacks any firm intraday direction and is influenced by a combination of diverging forces. The weaker US GDP print and a rise in US inflation benefit the metal amid subdued USD demand. Hawkish Fed expectations cap the upside as traders await the release of the US PCE Price Index.

Gold News

Sei Price Prediction: SEI is in the zone of interest after a 10% leap

Sei Price Prediction: SEI is in the zone of interest after a 10% leap

Sei price has been in recovery mode for almost ten days now, following a fall of almost 65% beginning in mid-March. While the SEI bulls continue to show strength, the uptrend could prove premature as massive bearish sentiment hovers above the altcoin’s price.

Read more

US core PCE inflation set to signal firm price pressures as markets delay Federal Reserve rate cut bets

US core PCE inflation set to signal firm price pressures as markets delay Federal Reserve rate cut bets

The core PCE Price Index, which excludes volatile food and energy prices, is seen as the more influential measure of inflation in terms of Fed positioning. The index is forecast to rise 0.3% on a monthly basis in March, matching February’s increase. 

Read more

Forex MAJORS

Cryptocurrencies

Signatures