NZD/USD Price Analysis: Exhibits volatility contraction near 0.5900
- NZD/USD falls to 0.5900 even though the US Dollar remains sideways.
- Investors await the US core PCE Price Index that will influence speculation for Fed rate cuts.
- NZD/USD consolidates in a 0.5850-0.5933 range for almost a week.

The NZD/USD pair drops to near the crucial support of 0.5900 in Tuesday’s European session while attempting to break above the immediate resistance of 0.5930. A sideways performance is anticipated from the Kiwi asset as investors await the United States core Personal Consumption Expenditure Price Index (PCE) data for March, which will be published on Friday.
The inflation data will be keenly watched as it will provide cues about when the Federal Reserve (Fed) could start reducing interest rates. The inflation data will influence the Fed’s guidance on interest rates, which will be provided in next week’s monetary policy meeting in which key borrowing rates are widely expected to remain unchanged in the range of 5.25%-5.50%.
Market sentiment remains cheerful as investors expect that conflicts between Iran and Israel will not widen further. S&P 500 futures have posted significant gains in the London session, portraying higher investors’ risk-appetite. 10-year US Treasury yields hovers near 4.63% with eyes on US core PCE inflation data, which is expected to have grown steadily by 0.3% on a month-on-month basis.
The New Zealand Dollar drops despite improved appeal for risk-sensitive assets. Meanwhile, expectations for the Reserve Bank of New Zealand (RBNZ) reducing interest rates later in November remain firm. The speculation for the RBNZ pivoting interest rate cuts postponed for later this year after the Q1 Consumer Price Index (CPI) grew expectedly by 0.6%.
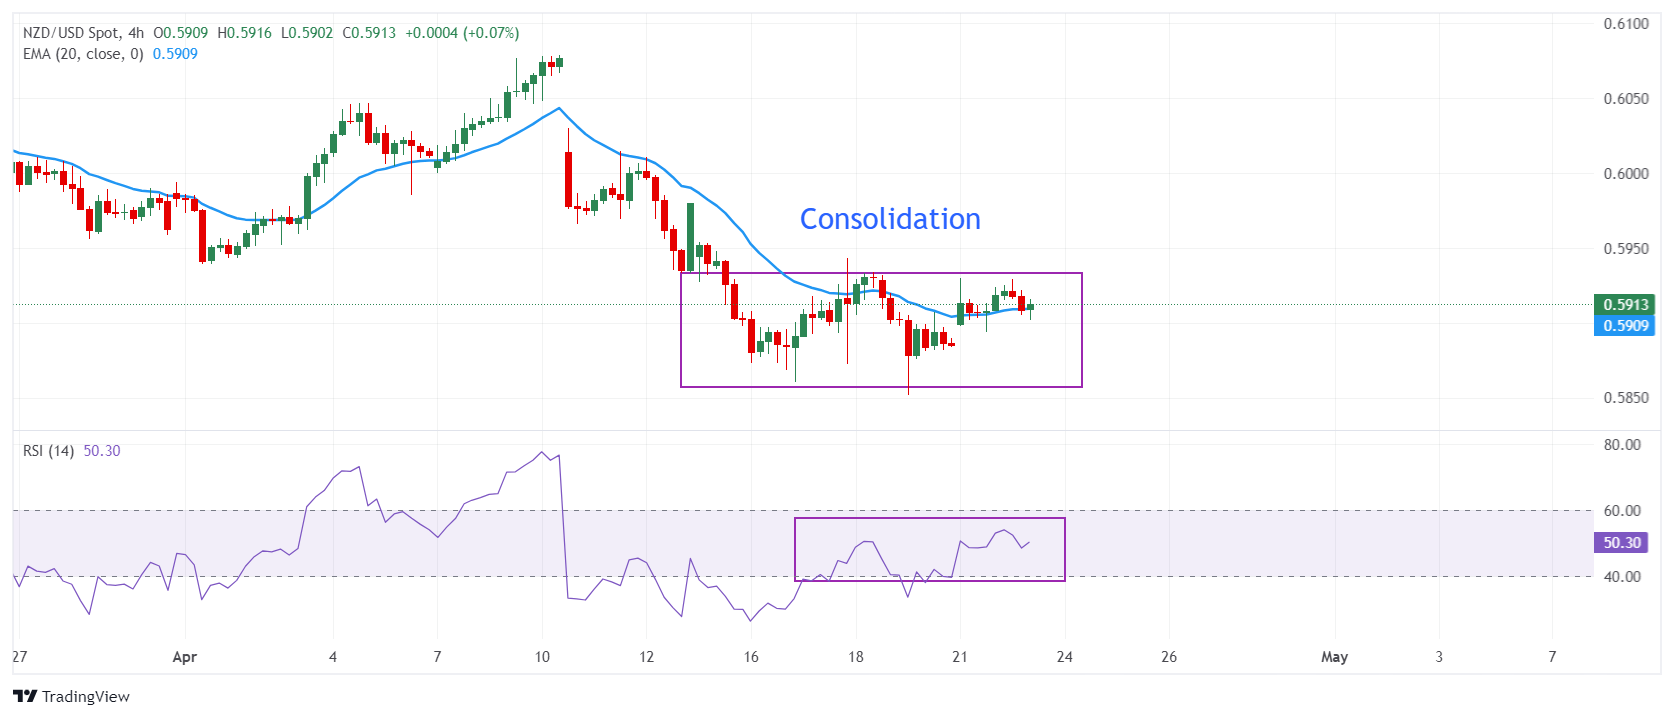
The NZD/USD pair has moved back and forth between 0.5850 and 0.5933 over the past week, suggesting a sharp volatility contraction. The 20-period Exponential Moving Average (EMA) at 0.5910 remains stuck to spot prices and exhibits indecisiveness among market participants.
The 14-period Relative Strength Index (RSI) oscillates in the 40.00-60.00 range, suggesting a consolidation ahead.
Fresh downside would appear if the asset breaks below April 16 low at 0.5860. This would drag the asset toward 8 September 2023 low at 0.5847, followed by the round-level support of 0.5900
On the flip side, a recovery move above March 18 high at 0.6100 will drive the pair toward March 12 low at 0.6135. A breach of the latter will drive the asset further to February 9 high around 0.6160.
NZD/USD four-hour chart
Author

Sagar Dua
FXStreet
Sagar Dua is associated with the financial markets from his college days. Along with pursuing post-graduation in Commerce in 2014, he started his markets training with chart analysis.