|

NZD/USD Price Analysis: Dives below 0.6020 on mixed China’s official PMI data

  • NZD/USD has sharply dived below 0.6020 amid mixed China’s Official PMI data.
  • China’s Manufacturing PMI at 48.8, lower than the estimates of 49.4 while Non-Manufacturing PMI jumped to 54.5 vs. 50.7.
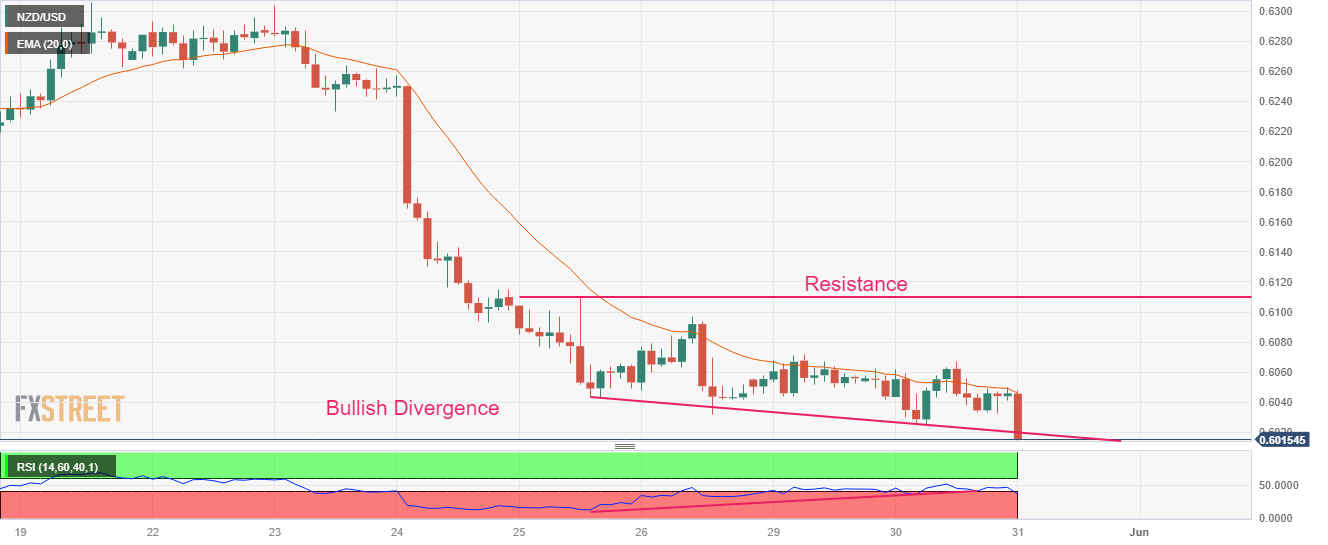
  • NZD/USD has formed a Bullish Divergence which indicates exhaustion in the downside momentum.

The NZD/USD pair has tumbled to near 0.6016 after the release of mixed China’s official PMI data (May). China’s National Bureau of Statistics (NBS) has reported Manufacturing PMI at 48.8, lower than the estimates of 49.4 and the former release of 49.2. While Non-Manufacturing PMI jumped to 54.5 from the consensus of 50.7 but remained lower than the former figure of 56.4.

The US Dollar Index (DXY) has extended its retreat move further below 104.04 as an approval of a raise in the US debt-ceiling has weakened its appeal. Going forward, the USD Index will be guided by the release of the US Automatic Data Processing (ADP) Employment Change data.

Going forward, New Zealand Dollar will continue its action ahead of the release of the Caixin Manufacturing PMI data (May). As per the consensus, the economic data is seen steady at 49.5. It is worth noting that New Zealand is one of the leading trading partners of China and a stagnant China's factory performance could impact the New Zealand Dollar.

NZD/USD has formed a Bullish Divergence on a two-hour scale, which indicates exhaustion in the downside momentum. The Kiwi asset was consistently making lower lows while the momentum oscillator Relative Strength Index (RSI) (14) made higher lows. The bullish divergence would get triggered after a decisive break above the crucial resistance of 0.6070.

The 20-period Exponential Moving Average (EMA) at 0.6048 is still acting as a barricade for the New Zealand Dollar bulls.

A confident break above the immediate resistance of 0.6070 will drive the Kiwi asset toward the horizontal resistance plotted from May 25 high at 0.6110 followed by May 01 low at 0.6160.

On the flip side, a downside move below the intraday low at 0.6015 will expose the asset for a fresh six-month low toward 11 November 2022 low at 0.5984. A slippage below the latter would expose the asset toward 02 November 2022 high at 0.5941.

NZD/USD two-hour chart

NZD/USD

Overview
Today last price0.6037
Today Daily Change-0.0007
Today Daily Change %-0.12
Today daily open0.6044
 
Trends
Daily SMA200.6213
Daily SMA500.6214
Daily SMA1000.626
Daily SMA2000.6152
 
Levels
Previous Daily High0.6067
Previous Daily Low0.6025
Previous Weekly High0.6303
Previous Weekly Low0.6032
Previous Monthly High0.6389
Previous Monthly Low0.6111
Daily Fibonacci 38.2%0.6041
Daily Fibonacci 61.8%0.6051
Daily Pivot Point S10.6024
Daily Pivot Point S20.6003
Daily Pivot Point S30.5982
Daily Pivot Point R10.6066
Daily Pivot Point R20.6087
Daily Pivot Point R30.6108

Author

Sagar Dua

Sagar Dua

FXStreet

Sagar Dua is associated with the financial markets from his college days. Along with pursuing post-graduation in Commerce in 2014, he started his markets training with chart analysis.

More from Sagar Dua
Share:

Markets move fast. We move first.

Orange Juice Newsletter brings you expert driven insights - not headlines. Every day on your inbox.

By subscribing you agree to our Terms and conditions.

Editor's Picks

EUR/USD rebounds after falling toward 1.1700

EUR/USD gains traction and trades above 1.1730 in the American session, looking to end the week virtually unchanged. The bullish opening in Wall Street makes it difficult for the US Dollar to preserve its recovery momentum and helps the pair rebound heading into the weekend.

GBP/USD steadies below 1.3400 as traders assess BoE policy outlook

Following Thursday's volatile session, GBP/USD moves sideways below 1.3400 on Friday. Investors reassess the Bank of England's policy oıtlook after the MPC decided to cut the interest rate by 25 bps by a slim margin. Meanwhile, the improving risk mood helps the pair hold its ground.

Gold stays below $4,350, looks to post small weekly gains

Gold struggles to gather recovery momentum and stays below $4,350 in the second half of the day on Friday, as the benchmark 10-year US Treasury bond yield edges higher. Nevertheless, the precious metal remains on track to end the week with modest gains as markets gear up for the holiday season.

Crypto Today: Bitcoin, Ethereum, XRP rebound amid bearish market conditions

Bitcoin (BTC) is edging higher, trading above $88,000 at the time of writing on Monday. Altcoins, including Ethereum (ETH) and Ripple (XRP), are following in BTC’s footsteps, experiencing relief rebounds following a volatile week.

How much can one month of soft inflation change the Fed’s mind?

One month of softer inflation data is rarely enough to shift Federal Reserve policy on its own, but in a market highly sensitive to every data point, even a single reading can reshape expectations. November’s inflation report offered a welcome sign of cooling price pressures. 

XRP rebounds amid ETF inflows and declining retail demand demand

XRP rebounds as bulls target a short-term breakout above $2.00 on Friday. XRP ETFs record the highest inflow since December 8, signaling growing institutional appetite.