NZD/USD Price Analysis: Bear flag highlights 0.6315 as the key support


  • NZD/USD extends late Thursday’s pullback from weekly high inside bearish chart pattern.
  • RSI, MACD conditions suggest buyers are running out of steam while pullback from 200-SMA strengthens downside bias.
  • Late January’s swing low adds to the upside filters before welcoming Kiwi buyers.

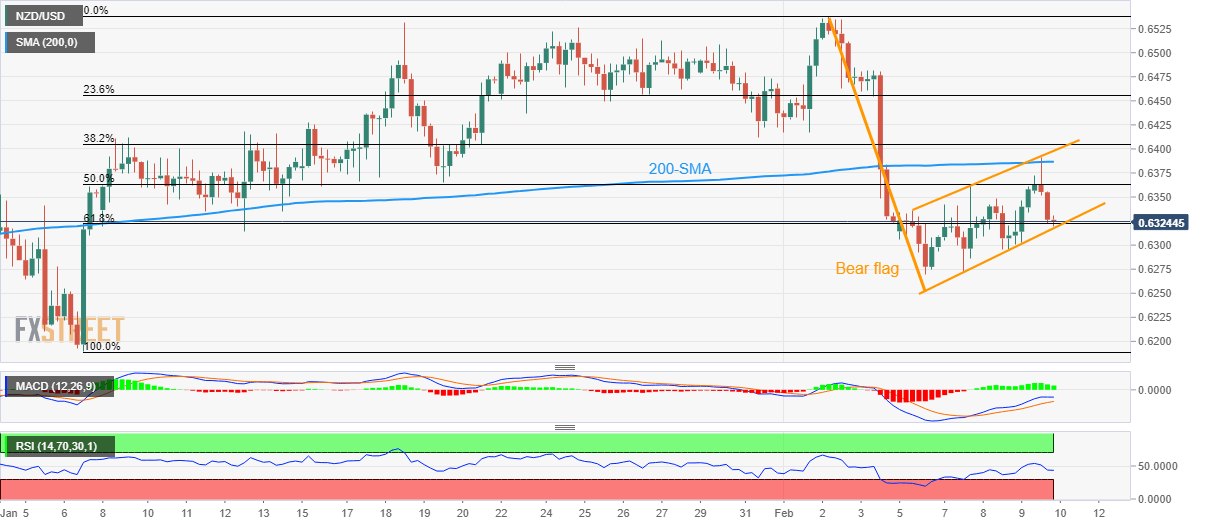
NZD/USD teases sellers inside a bearish formation as it drops to 0.6320 during the early hours of Friday morning in New Zealand. In doing so, the Kiwi pair extends the late Thursday pullback from the one-week high.

In addition to the weekly bear flag chart pattern, the quote’s inability to cross the 200-SMA also teases the sellers. Furthermore, the receding strength of the bullish MACD signals and the sluggish rise in the RSI adds strength to the downside bias.

However, a clear downside break of the stated flag’s lower line, close to 0.6315 by the press time, becomes necessary to trigger a theoretical fall towards the mid-November 2022 low surrounding 0.6065.

That said, monthly lows marked so far during 2023, around 0.6270 and 0.6190, could offer intermediate halts during the anticipated slump between 0.6315 and 0.6065.

Alternatively, the 50% Fibonacci retracement level of the NZD/USD pair’s January-February upside, near 0.6365, could act as an immediate resistance to watch during the recovery.

Following that, the 200-SMA and the stated flag’s top line, respectively near 0.6385 and the 0.6400 threshold, will be crucial to watch as they hold the keys to the NZD/USD bull’s entry.

NZD/USD: Four-hour chart

Trend: Further downside expected

Additional important levels

Overview
Today last price 0.6323
Today Daily Change 0.0016
Today Daily Change % 0.25%
Today daily open 0.6307
 
Trends
Daily SMA20 0.6425
Daily SMA50 0.6376
Daily SMA100 0.6119
Daily SMA200 0.6189
 
Levels
Previous Daily High 0.6349
Previous Daily Low 0.6296
Previous Weekly High 0.6538
Previous Weekly Low 0.6322
Previous Monthly High 0.6531
Previous Monthly Low 0.619
Daily Fibonacci 38.2% 0.6316
Daily Fibonacci 61.8% 0.6329
Daily Pivot Point S1 0.6286
Daily Pivot Point S2 0.6265
Daily Pivot Point S3 0.6233
Daily Pivot Point R1 0.6338
Daily Pivot Point R2 0.637
Daily Pivot Point R3 0.6391


Share: Feed news

Information on these pages contains forward-looking statements that involve risks and uncertainties. Markets and instruments profiled on this page are for informational purposes only and should not in any way come across as a recommendation to buy or sell in these assets. You should do your own thorough research before making any investment decisions. FXStreet does not in any way guarantee that this information is free from mistakes, errors, or material misstatements. It also does not guarantee that this information is of a timely nature. Investing in Open Markets involves a great deal of risk, including the loss of all or a portion of your investment, as well as emotional distress. All risks, losses and costs associated with investing, including total loss of principal, are your responsibility. The views and opinions expressed in this article are those of the authors and do not necessarily reflect the official policy or position of FXStreet nor its advertisers. The author will not be held responsible for information that is found at the end of links posted on this page.

If not otherwise explicitly mentioned in the body of the article, at the time of writing, the author has no position in any stock mentioned in this article and no business relationship with any company mentioned. The author has not received compensation for writing this article, other than from FXStreet.

FXStreet and the author do not provide personalized recommendations. The author makes no representations as to the accuracy, completeness, or suitability of this information. FXStreet and the author will not be liable for any errors, omissions or any losses, injuries or damages arising from this information and its display or use. Errors and omissions excepted.

The author and FXStreet are not registered investment advisors and nothing in this article is intended to be investment advice.

Recommended content


Recommended content

Editors’ Picks

EUR/USD holds above 1.0800 ahead of Eurozone GDP, US inflation data

EUR/USD holds above 1.0800 ahead of Eurozone GDP, US inflation data

EUR/USD stays in positive territory above 1.0800 after registering its highest daily close in over a month on Tuesday. Investors await first-quarter GDP data from the Euro area and April Consumer Price Index data from the US. 

EUR/USD News

GBP/USD consolidates its gains above 1.2580, all eyes on US CPI data

GBP/USD consolidates its gains above 1.2580, all eyes on US CPI data

GBP/USD consolidates its gains around 1.2590 during the Asian session on Wednesday. The major pair holds above the key 100-day EMA but remains capped under the 1.2600 hurdle. The US CPI and Retail Sales report for April will be in the spotlight.

GBP/USD News

Gold price trades with a mild positive bias, US CPI and PPI data loom

Gold price trades with a mild positive bias, US CPI and PPI data loom

Gold price posts modest gains on the weaker US Dollar on Wednesday. The rising gold demand from robust over-the-counter market investments, consistent central bank purchases, and safe-haven flows amid Middle East geopolitical risk act as a tailwind for XAU/USD. 

Gold News

Ethereum bears attempt to take lead following increased odds for a spot ETH ETF denial

Ethereum bears attempt to take lead following increased odds for a spot ETH ETF denial

Ethereum is indicating signs of a bearish move on Tuesday as it is largely trading horizontally. Its co-founder Vitalik Buterin has also proposed a new type of gas fee structure, while the chances of the SEC approving a spot ETH ETF decrease with every passing day.

Read more

US CPI data expected to show slow progress towards 2% target

US CPI data expected to show slow progress towards 2% target

The US Consumer Price Index is set to rise 3.4% YoY in April, following the 3.5% increase in March. Annual core CPI inflation is expected to edge lower to 3.6% in April. The inflation report could influence the timing of the Fed’s policy pivot.

Read more

Forex MAJORS

Cryptocurrencies

Signatures