NZD/USD Price Analysis: Aims to recapture 0.6100 as RBNZ maintains hawkish guidance
- NZD/USD marches toward 0.6100 as RBNZ’s hawkish interest rate outlook strengthens the Kiwi dollar.
- The RBNZ kept its OCR steady at 5.5% for the sixth time in a row.
- Investors await the US Inflation data that will influence expectations for Fed pivoting to rate cuts.

The NZD/USD pair advances toward the round-level resistance of 0.6100. The Kiwi asset exhibited strength in Wednesday’s European session as the Reserve Bank of New Zealand (RBNZ) delivered hawkish guidance after keeping its Official Cash Rate (OCR) unchanged at 5.50%.
The RBNZ hold its OCR steady at 5.50% for the sixth time in a row. The RBNZ commented that the monetary policy will remain restrictive to maintain downward pressure on inflationary pressures. The New Zealand economy is going through a rough phase as it remained in a technical recession in the second-half of 2023. Though the RBNZ needs to make a balance as annual inflation at 4.7% is significantly higher than the desired range between 1% and 3%.
Meanwhile, investors await the United States Consumer Price Index (CPI) data for March, which will be published at 12:30 GMT. According to economists, monthly headline and core inflation data are projected to have increased by 0.3%, higher than the pace of 0.17%, which is required for inflation to come down to the 2% target. This would not convince Federal Reserve (Fed) policymakers to consider rate cuts by the first half of this year.
The appeal for the US Dollar will strengthen if the inflation data turns out hotter than expected. Currently, the US Dollar Index (DXY), which tracks the US Dollar’s value against six major currencies, is slightly down to 104.00.
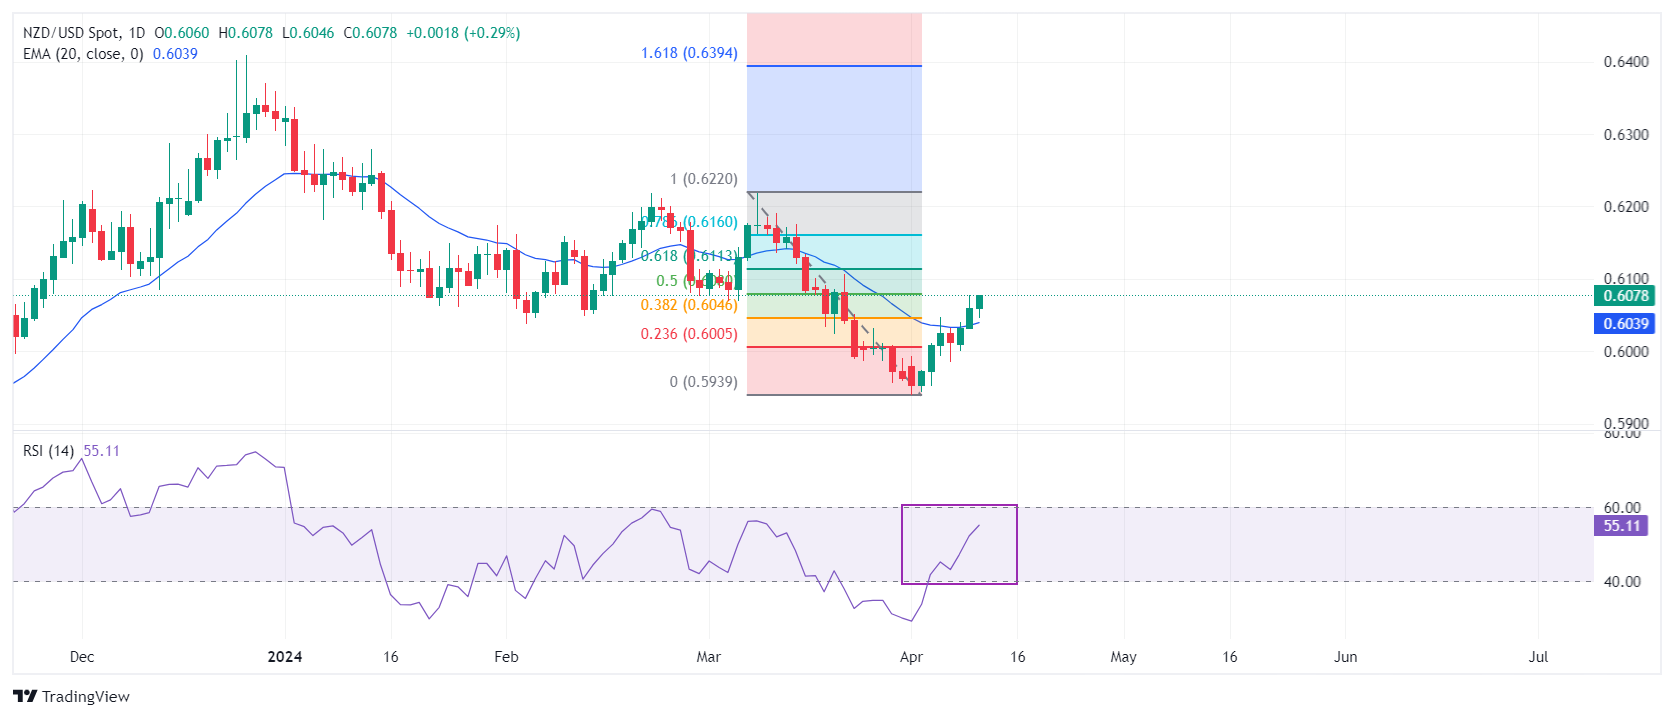
NZD/USD continues its winning spell for the third trading session on Wednesday. The Kiwi asset recovers to 50% of the Fibonacci retracement (plotted from March 8 high at 0.6218 to April 1 low near 0.5940), which is at 0.6080. The asset remains above the 20-day Exponential Moving Average, which trades around 0.6040, suggesting that near-term demand remains intact.
The 14-period Relative Strength Index (RSI) approaches 60.00. If the RSI manages to break decisively above that level, bullish momentum will trigger.
Further upside above March 18 high at 0.6100 will drive the pair toward March 12 low at 0.6135. A breach of the latter will drive the asset to 78.6% Fibo retracement at 0.6160.
In an alternate scenario, a downside move would appear if the asset breaks below April 5 low of 0.5985. This would drag the asset toward November 17 low at 0.5940, followed by the round-level support of 0.5900.
NZD/USD four-hour chart
Author

Sagar Dua
FXStreet
Sagar Dua is associated with the financial markets from his college days. Along with pursuing post-graduation in Commerce in 2014, he started his markets training with chart analysis.


