NZD/USD dips below 0.6000: US inflation and RBNZ’s dovish stance weighs on NZD
- US Producer Price Index (PPI) surpasses estimates, bolstering the US Dollar as Treasury yields soar.
- Reserve Bank of New Zealand (RBNZ) is expected to maintain rates at 5.50%, adding pressure on the NZD.
- NZD/USD’s future hinges on US economic data and potential RBNZ rate surprises; 0.5900 level in sight.

NZD/USD plunges below 0.6000, set to finish the week with losses of 1.86% after inflation data in the United States (US), although mixed, weighed on the NZD/USD pair. Furthermore, the Reserve Bank of New Zealand (RBNZ) adopting a dovish stance was the last nail in the coffin for the Kiwi dollar (NZD). The NZD/USD exchanges hands at 0.5981, down 0.65%.
Kiwi dollar faces headwinds from mixed US inflation data and RBNZ’s anticipated rate hold
During the week, the NZD/USD extended its losses courtesy of fundamental news, with US inflation data in the spotlight. Data was mixed, with consumer inflation ticking a little up, but stood below estimates, confirming US disinflationary process. Still, not everything was positive news, as factory prices, known as the Producer Price Index (PPI) for July, exceeded estimates and the prior’s month data. Hence, traders bought the US Dollar (USD) underpinned by soaring US Treasury bond yields, to the detriment of the New Zealand Dollar (NZD).
US Treasury bond yields advanced sharply as traders turned nervous after the data reignited fears of price pressures, which could influence the US Federal Reserve (Fed) to tighten monetary conditions. The US 10-year yields rose nine basis points to 4.168%, while the most sensitive to interest rates, the US 2-year yield, climbed nine basis points to 4.90%.
Consequently, the US Dollar Index (DXY), which measures the buck’s performance vs. its peers, advances 0.32%, at 102.853, printed solid gains during the week.
On the New Zealand (NZ) front, weakness in business activity weighed on the NZD. Worth mentioning that a Reuters poll said that most analysts estimate the Reserve Bank of New Zealand (RBNZ) will keep rates unchanged at 5.50%, at a 14-year high, for the second straight meeting, on August 16. Only two of 29 analysts said that rates would need to rise to 5.75%.
Given the backdrop, the NZD/USD could extend its downtrend, favored by the RBNZ’z stance. If US economic data becomes weaker than expected and the RBNZ surprises the market with a rate hike, the NZD/USD could reclaim the 0.6000 figure. Otherwise, look for a break below 0.5900, with sellers eyeing last year’s October lows of 0.5512.
NZD/USD Price Analysis: Technical outlook
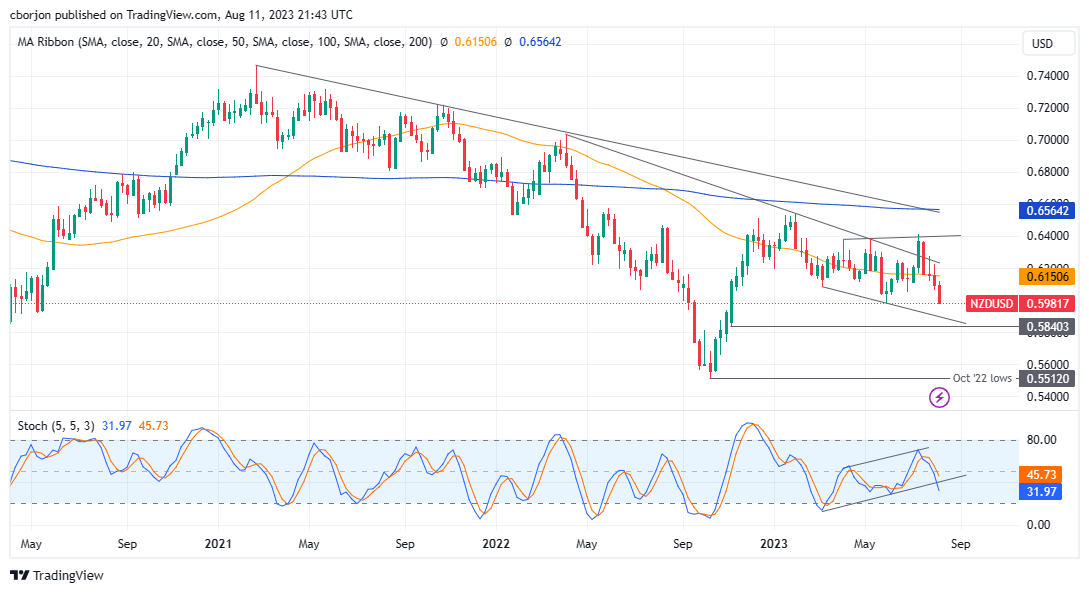
From a technical perspective, the NZD/USD is set to extend its losses, as the weekly chart portrays a ‘broadening formation’, suggesting that further downside is expected. The break of the pair below the 50-week moving average accelerated the NZD/USD’s fall, and a daily close below the May 2023 lows of 0.5985 could put into play a fall towards the bottom of the ‘broadening formation’ at around 0.5875/0.5900. A drop below that level would put last year’s October low at 0.5512 in play.
Author

Christian Borjon Valencia
FXStreet
Markets analyst, news editor, and trading instructor with over 14 years of experience across FX, commodities, US equity indices, and global macro markets.


