|

NZD/JPY Price Analysis: Bulls add gains and indicators reach overbought conditions

  • The positive outlook on the daily chart improved but bulls aren’t yet in command.
  • the RSI was seen above 70 in recent hours, which may lead to a consolidation.
  • To prevent any potential losses, the bulls must defend the key SMAs.

In Tuesday's session, NZD/JPY is trading at 91.36, registering an uptick of 0.74%. Despite some signals of a consolidation incoming, the market sees dominance by buyers, which leads to a broader bullish outlook. Ahead of the Asian session, the pair may correct overbought conditions on the hourly chart and see some red.

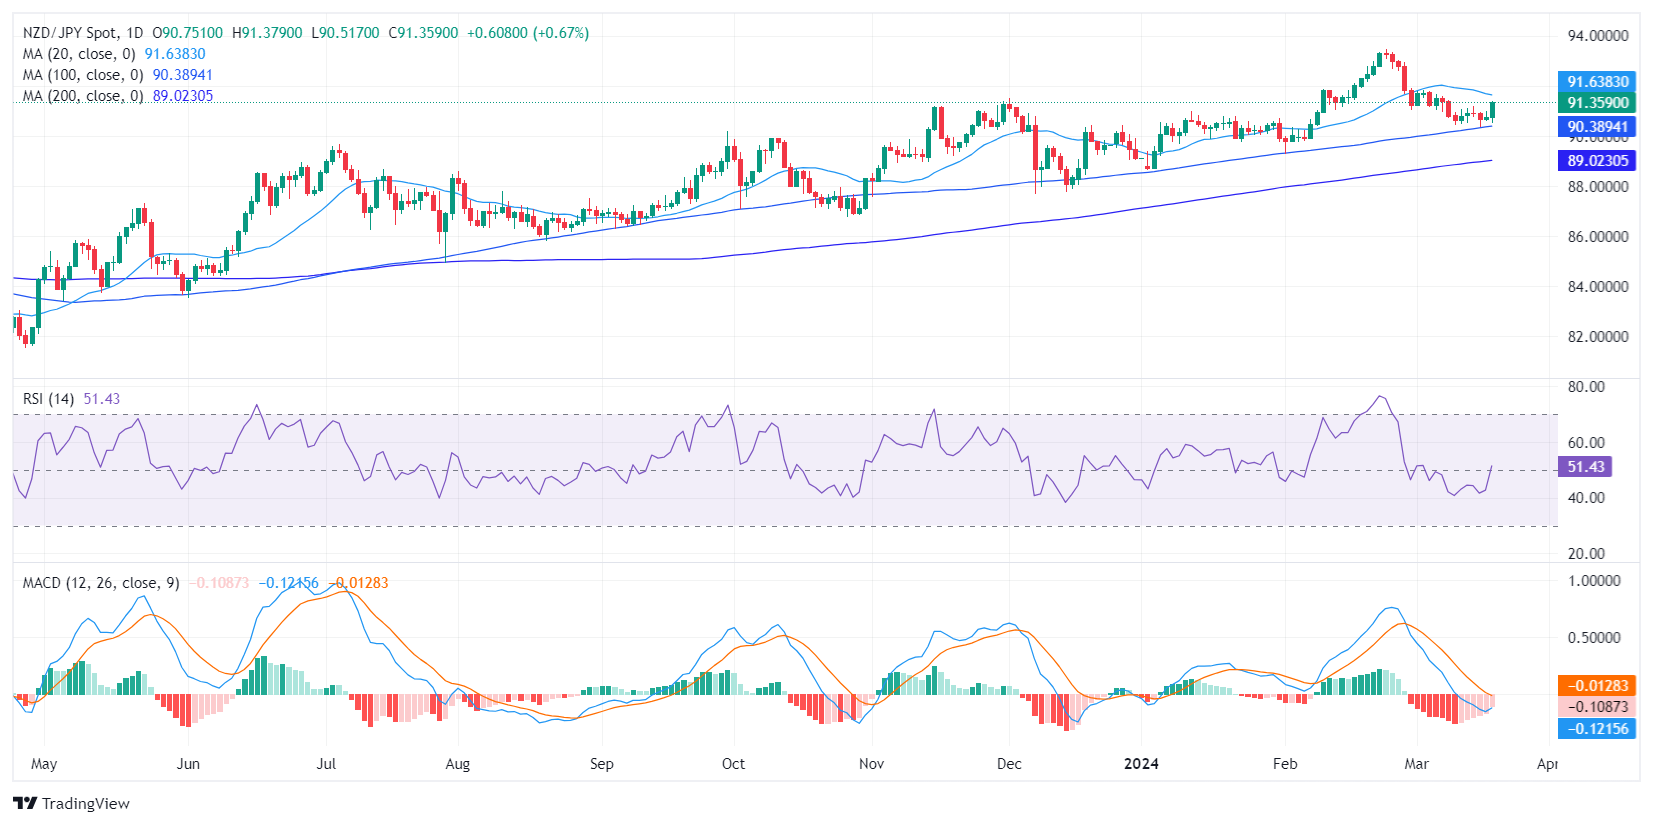
On the daily chart, the NZD/JPY pair posts positive momentum following a shift from the negative territory. The Relative Strength Index (RSI) now sits in the positive territory at 52 while the Moving Average Convergence Divergence (MACD) red bars recede, signaling a potential decrease in negative momentum.

NZD/JPY daily chart

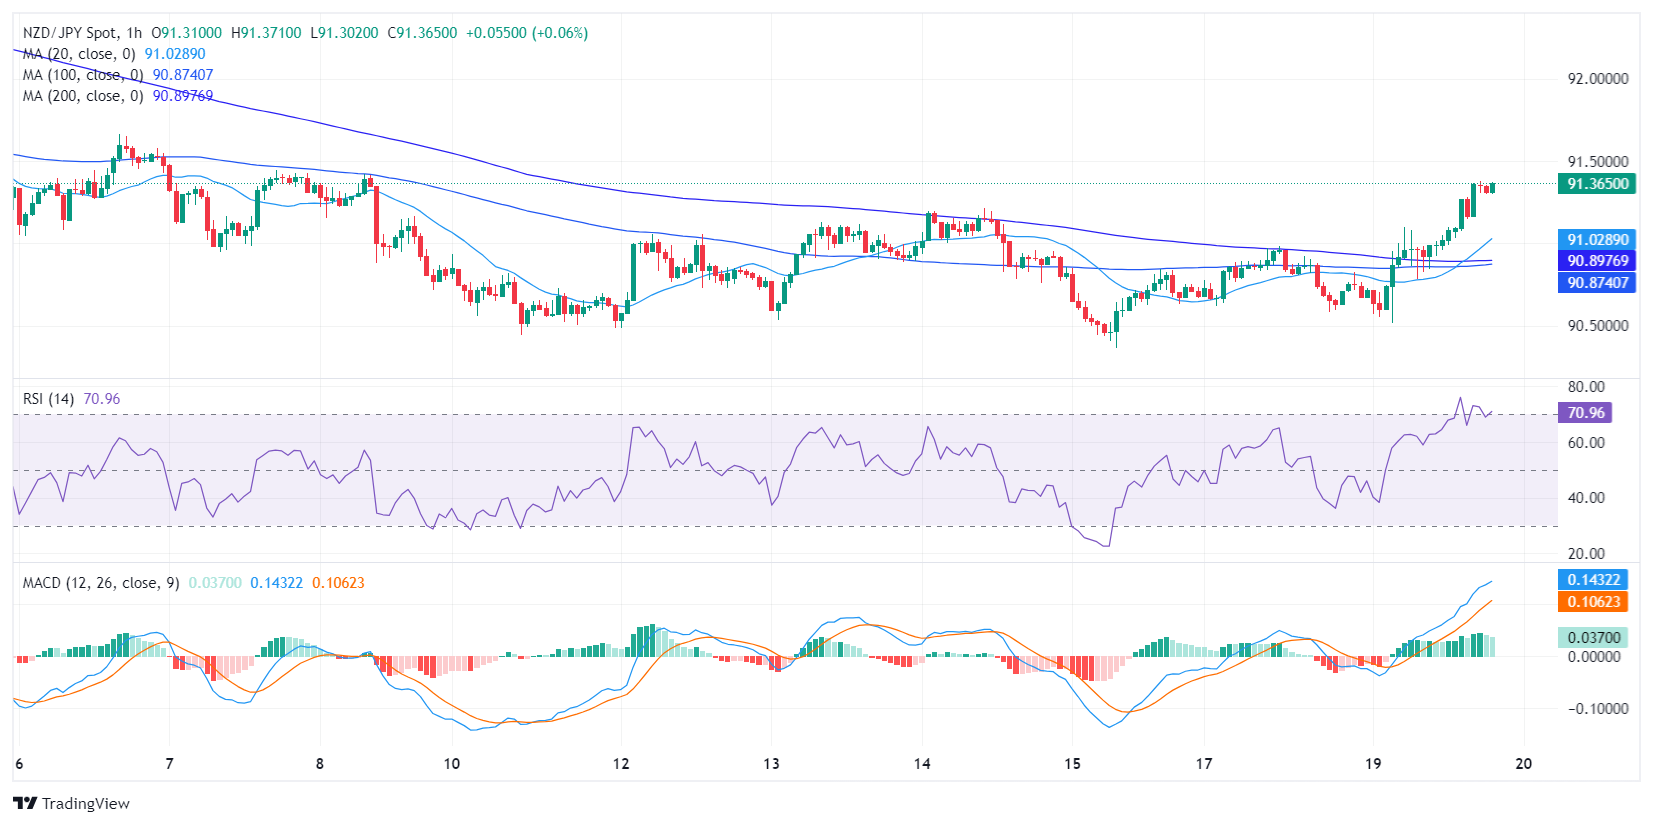
Transitioning to the hourly chart, the NZD/JPY pair displays a stronger positive trend. The RSI enters the overbought territory due to consistent readings above 70. Sharp green bars in the MACD histogram signify strong positive momentum over the past few hours, suggesting buyers dominate the market for now. An RSI above 70 suggests an overextended buying momentum which typically leads to a downward consolidation

NZD/JPY hourly chart

In conclusion, both daily and hourly analyses point to a bullish outlook for the NZD/JPY pair. Traders should monitor the MACD for continued red bar reduction or a shift to green bars, and the RSI to see if it remains within or moves away from the overbought territory in the hourly chart. These data points would suggest a potential price reversal or continuation, respectively.

Regarding a Simple Moving Average (SMA) analysis, despite the bears gaining ground and pushing the pair below the 20-day Simple Moving Average (SMA), the pair remains above the 100 and 200-day SMAs. This pattern suggests that the bulls maintain control of the overall trend.

NZD/JPY

Overview
Today last price91.35
Today Daily Change0.60
Today Daily Change %0.66
Today daily open90.75
 
Trends
Daily SMA2091.69
Daily SMA5091.06
Daily SMA10090.36
Daily SMA20089
 
Levels
Previous Daily High90.99
Previous Daily Low90.58
Previous Weekly High91.22
Previous Weekly Low90.37
Previous Monthly High93.45
Previous Monthly Low89.26
Daily Fibonacci 38.2%90.83
Daily Fibonacci 61.8%90.74
Daily Pivot Point S190.56
Daily Pivot Point S290.37
Daily Pivot Point S390.15
Daily Pivot Point R190.96
Daily Pivot Point R291.18
Daily Pivot Point R391.37

Author

Patricio Martín

Patricio is an economist from Argentina passionate about global finance and understanding the daily movements of the markets.

More from Patricio Martín
Share:

Markets move fast. We move first.

Orange Juice Newsletter brings you expert driven insights - not headlines. Every day on your inbox.

By subscribing you agree to our Terms and conditions.

Editor's Picks

EUR/USD: Bulls pray for a dovish Fed

EUR/USD has finally taken a breather after a pretty energetic climb. The pair broke above 1.1680 in the second half of the week, reaching its highest levels in around two months before running into some selling pressure. Even so, it has gained almost two cents from the late-November dip just below 1.1500 the figure.

GBP/USD trims gains, recedes toward 1.3320

GBP/USD is struggling to keep its daily advance, coming under fresh pressure and retreating to the 1.3320 zone following a mild bullish attempt in the Greenback. Even though US consumer sentiment surprised to the upside, the US Dollar isn’t getting much love, as traders are far more interested in what the Fed will say next week.

Gold: Bullish momentum fades despite broad USD weakness

After rising more than 3.5% in the previous week, Gold has entered a consolidation phase and fluctuated at around $4,200. The Federal Reserve’s interest rate decision and revised Summary of Economic Projections, also known as the dot plot, could trigger the next directional move in XAU/USD. 

Week ahead: Rate cut or market shock? The Fed decides

Fed rate cut widely expected; dot plot and overall meeting rhetoric also matter. Risk appetite is supported by Fed rate cut expectations; cryptos show signs of life. RBA, BoC and SNB also meet; chances of surprises are relatively low. Dollar weakness could linger; both the aussie and the yen best positioned to gain further. Gold and oil eye Ukraine-Russia developments; a peace deal remains elusive.

Week ahead – Rate cut or market shock? The Fed decides

Fed rate cut widely expected; dot plot and overall meeting rhetoric also matter. Risk appetite is supported by Fed rate cut expectations; cryptos show signs of life. RBA, BoC and SNB also meet; chances of surprises are relatively low.

Ripple faces persistent bear risks, shrugging off ETF inflows

Ripple is extending its decline for the second consecutive day, trading at $2.06 at the time of writing on Friday. Sentiment surrounding the cross-border remittance token continues to lag despite steady inflows into XRP spot ETFs.