|

NZD/JPY Price Analysis: Bearish sentiment rules, potential seller fatigue signals a pause

  • Indications from the daily chart imply a dominance by sellers for the short term.
  • The same indicators on the hourly chart also imply a bearish momentum, although depicting potential signs of diminishing selling traction.
  • The hourly RSI is recovering after hitting oversold conditions earlier in the session.

In Friday's session, the NZD/JPY pair is currently changing hands at 90.84, down 0.50%. The technical outlook for the pair points to strong control from sellers. Even though the market has been under a selling spree, recent conditions hint at a potential weakening of this selling pressure.

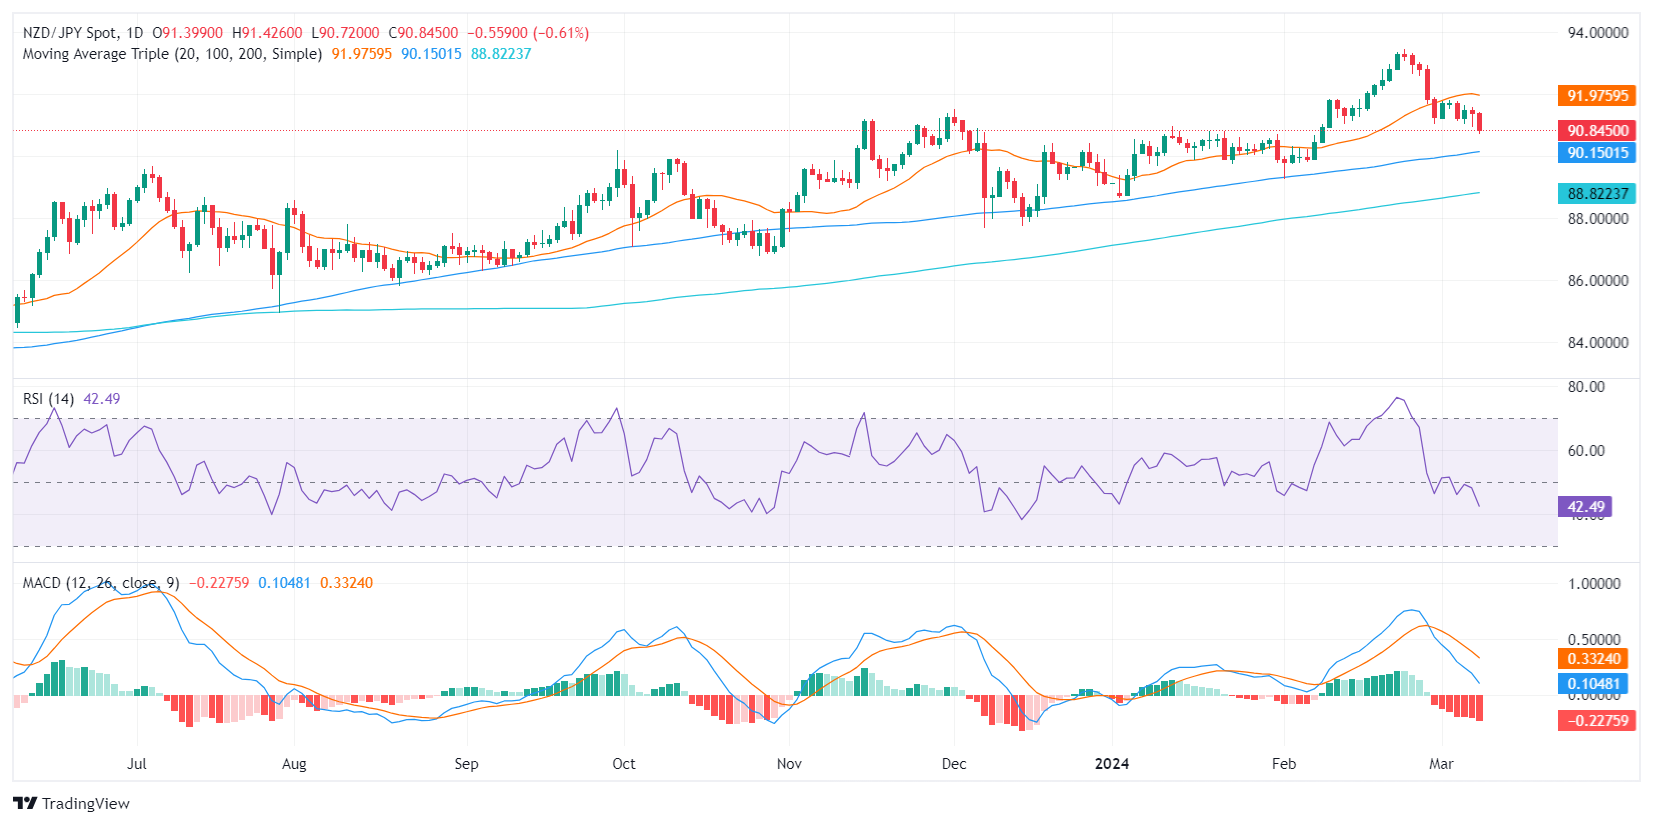
Based on the indicators of the daily chart, the NZD/JPY pair appears to be dominated by sellers. The Relative Strength Index (RSI) remains within negative territory. Additionally, the rising red bars on the Moving Average Convergence Divergence (MACD), which suggest negative momentum, strengthen the belief of ongoing bearish sentiment.

NZD/JPY daily chart

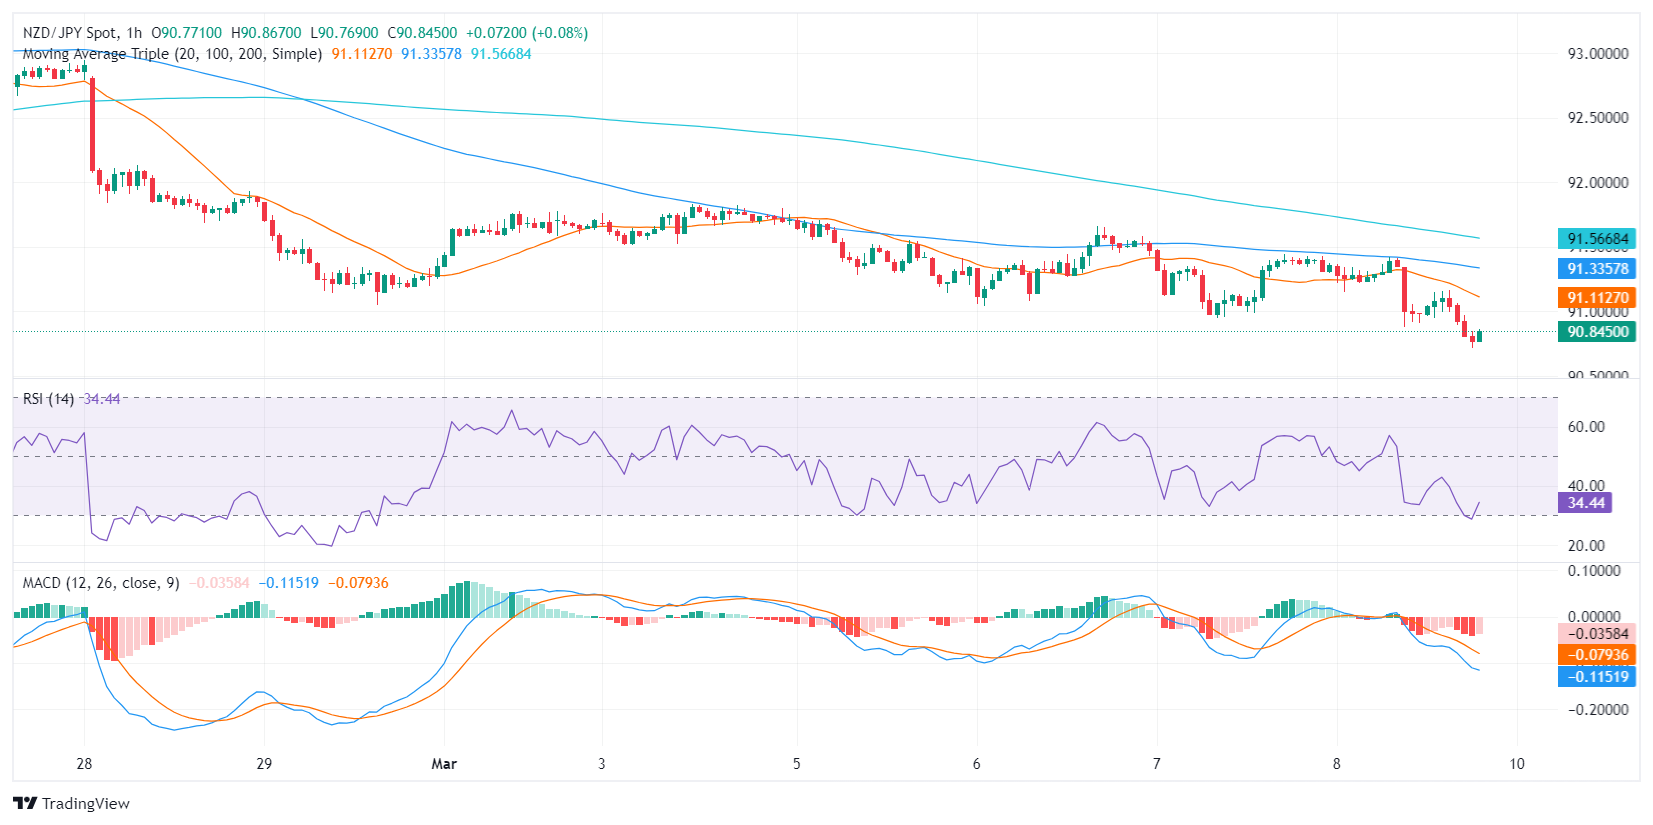
Shifting attention to the hourly chart, the RSI oscillates near the oversold territory, indicating heavy selling pressure. However, the recent uptick in the RSI value might suggest seller fatigue. Combined with the decreasing red bars in the MACD histogram, this demonstrates a possible loss in the pace of negative momentum.

NZD/JPY hourly chart

In conclusion, there is consistency between the daily and hourly charts, both implying bearish momentum in NZD/JPY. However, the latest hourly indicators hint towards a possible slowdown in the selling pressure – a divergence that traders should keep an eye on. In addition, the overall trend continues to favor the buyers as the cross remains above the 100 and 200-day Simple Moving Averages (SMAs). The fact that it sits below the 20-day Average adds negativity to the short-term outlook.

NZD/JPY

Overview
Today last price90.85
Today Daily Change-0.55
Today Daily Change %-0.60
Today daily open91.4
 
Trends
Daily SMA2092.03
Daily SMA5090.89
Daily SMA10090.12
Daily SMA20088.79
 
Levels
Previous Daily High91.58
Previous Daily Low90.95
Previous Weekly High93.35
Previous Weekly Low91.05
Previous Monthly High93.45
Previous Monthly Low89.26
Daily Fibonacci 38.2%91.19
Daily Fibonacci 61.8%91.34
Daily Pivot Point S191.04
Daily Pivot Point S290.68
Daily Pivot Point S390.41
Daily Pivot Point R191.67
Daily Pivot Point R291.94
Daily Pivot Point R392.31

Author

Patricio Martín

Patricio is an economist from Argentina passionate about global finance and understanding the daily movements of the markets.

More from Patricio Martín
Share:

Markets move fast. We move first.

Orange Juice Newsletter brings you expert driven insights - not headlines. Every day on your inbox.

By subscribing you agree to our Terms and conditions.

Editor's Picks

EUR/USD: Bulls pray for a dovish Fed

EUR/USD has finally taken a breather after a pretty energetic climb. The pair broke above 1.1680 in the second half of the week, reaching its highest levels in around two months before running into some selling pressure. Even so, it has gained almost two cents from the late-November dip just below 1.1500 the figure.

GBP/USD trims gains, recedes toward 1.3320

GBP/USD is struggling to keep its daily advance, coming under fresh pressure and retreating to the 1.3320 zone following a mild bullish attempt in the Greenback. Even though US consumer sentiment surprised to the upside, the US Dollar isn’t getting much love, as traders are far more interested in what the Fed will say next week.

Gold: Bullish momentum fades despite broad USD weakness

After rising more than 3.5% in the previous week, Gold has entered a consolidation phase and fluctuated at around $4,200. The Federal Reserve’s interest rate decision and revised Summary of Economic Projections, also known as the dot plot, could trigger the next directional move in XAU/USD. 

Week ahead: Rate cut or market shock? The Fed decides

Fed rate cut widely expected; dot plot and overall meeting rhetoric also matter. Risk appetite is supported by Fed rate cut expectations; cryptos show signs of life. RBA, BoC and SNB also meet; chances of surprises are relatively low. Dollar weakness could linger; both the aussie and the yen best positioned to gain further. Gold and oil eye Ukraine-Russia developments; a peace deal remains elusive.

Week ahead – Rate cut or market shock? The Fed decides

Fed rate cut widely expected; dot plot and overall meeting rhetoric also matter. Risk appetite is supported by Fed rate cut expectations; cryptos show signs of life. RBA, BoC and SNB also meet; chances of surprises are relatively low.

Ripple faces persistent bear risks, shrugging off ETF inflows

Ripple is extending its decline for the second consecutive day, trading at $2.06 at the time of writing on Friday. Sentiment surrounding the cross-border remittance token continues to lag despite steady inflows into XRP spot ETFs.