- The NZD/JPY trades at 91.567, recording 0.23% losses in Monday's session.
- The RBNZ is expected to continue hiking, leading to a terminal rate of 6% by April.
- Markets are betting on a BoJ liftoff by June.
In Monday's session, the NZD/JPY declined to 91.55 with a slight downtrend of 0.23%. As market participants anticipate diverging strategies between the Reserve Bank of New Zealand (RBNZ) and Bank of Japan (BoJ), NZD/JPY the Kiwi is set for further strengthening as the downside could be explained by investors taking profits and consolidating gains.
The RBNZ Governor Orr appeared before a parliamentary committee and maintained a hawkish stance, signaling that steady inflation at 4.7% YoY is still above the 2% target and hinting that additional tightening may be appropriate. As for now, the odds of a February hike stand at 33% and rose to 65% by May.
In addition, as the New Zealand economic climate remains robust, fueling expectations of a more aggressive central bank policy, the slow economic growth and low inflation in Japan could push BoJ towards further easing and delay a lift until June weakening the pair. Key economic indicators and policy announcements from both banks will likely shape the NZD/JPY pair's dynamics substantially, with market participants eyeing upcoming RBNZ and BoJ meetings.
NZD/JPY technical analysis
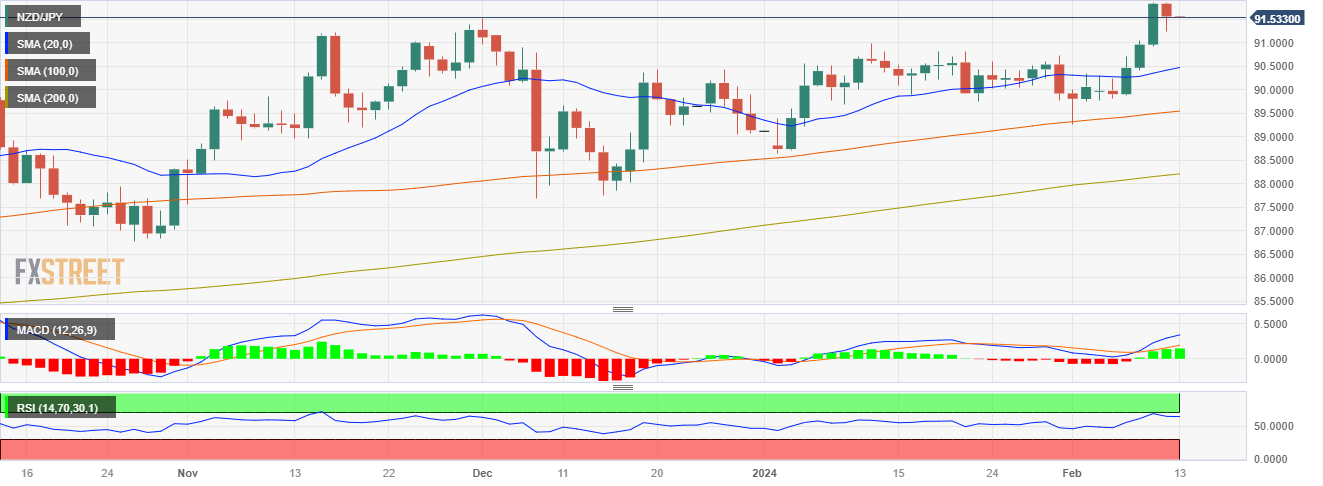
The daily chart's Relative Strength Index (RSI) stands in positive territory, marking descending from overbought regions, aligning with a bullish perspective. This downward slope suggests a slight weakening in buying momentum as buyers take profits and consolidate gains. The Moving Average Convergence Divergence (MACD) histogram prints green bars, indicating that buyers are maintaining control over the market direction.
In contrast, the hourly RSI paints a slightly negative territory, as it fell to near its 50 middle points while the hourly MACD histogram, on the other hand, prints declining green bars, indicating a building negative momentum.
Considering the juxtaposition of daily and hourly dynamics, it seems likely that the NZD/JPY pair is following a temporary pullback within a broader bullish trend as it sits above the 20,100,200-day Simple Moving Average (SMA). This suggests a possible dominance of buyers in the larger time frame, despite short-term selling pressure.
NZD/JPY daily chart
Information on these pages contains forward-looking statements that involve risks and uncertainties. Markets and instruments profiled on this page are for informational purposes only and should not in any way come across as a recommendation to buy or sell in these assets. You should do your own thorough research before making any investment decisions. FXStreet does not in any way guarantee that this information is free from mistakes, errors, or material misstatements. It also does not guarantee that this information is of a timely nature. Investing in Open Markets involves a great deal of risk, including the loss of all or a portion of your investment, as well as emotional distress. All risks, losses and costs associated with investing, including total loss of principal, are your responsibility. The views and opinions expressed in this article are those of the authors and do not necessarily reflect the official policy or position of FXStreet nor its advertisers. The author will not be held responsible for information that is found at the end of links posted on this page.
If not otherwise explicitly mentioned in the body of the article, at the time of writing, the author has no position in any stock mentioned in this article and no business relationship with any company mentioned. The author has not received compensation for writing this article, other than from FXStreet.
FXStreet and the author do not provide personalized recommendations. The author makes no representations as to the accuracy, completeness, or suitability of this information. FXStreet and the author will not be liable for any errors, omissions or any losses, injuries or damages arising from this information and its display or use. Errors and omissions excepted.
The author and FXStreet are not registered investment advisors and nothing in this article is intended to be investment advice.
Recommended content
Editors’ Picks
AUD/USD regains the constructive outlook above the 200-day SMA

AUD/USD advanced strongly for the second session in a row, this time extending the recovery to the upper 0.6500s and shifting its focus to the weekly highs in the 0.6580-0.6585 band, an area coincident with the 100-day SMA.
EUR/USD keeps the bullish performance above 1.0700

The continuation of the sell-off in the Greenback in the wake of the FOMC gathering helped EUR/USD extend its bounce off Wednesday’s lows near 1.0650, advancing past the 1.0700 hurdle ahead of the crucial release of US NFP on Friday.
Gold stuck around $2,300 as market players lack directional conviction

Gold extended its daily slide and dropped below $2,290 in the second half of the day on Thursday. The benchmark 10-year US Treasury bond yield erased its daily losses after US data, causing XAU/USD to stretch lower ahead of Friday's US jobs data.
Bitcoin price rises 5% as BlackRock anticipates a new wave of capital inflows into BTC ETFs from investors

Bitcoin (BTC) price slid to the depths of $56,552 on Wednesday as the cryptocurrency market tried to front run the Federal Open Market Committee (FOMC) meeting. The flash crash saw millions in positions get liquidated.
FOMC in the rear-view mirror – NFP eyed

The update from May’s FOMC rate announcement proved more dovish than expected, which naturally weighed on the US dollar (sending the DXY to lows of 105.44) and US yields, as well as, initially at least, underpinning major US equity indices.