Nvidia Stock Forecast: trades lower on Wednesday after Fed announcement
- Nvidia is trading lower during Wednesday’s session.
- NVDA is more than 13% off its August 24 all-time high.
- The Federal Reserve has released its statement and dot-plot.
- The dot-plot is showing a hawkish shift in expectations.

Nvidia (NVDA) stock slides lower midweek after the Federal Reserve’s interest rate decision at 14:00 EST / 18:00 GMT. NVDA is trading over a percentage point down after the release of the Fed's September meeting statement and the forecasts in the accompanying Survey of Economic Projections. The Fed report includes the 'dot-plot' – a table forecasting the future course of interest rates based on each member's responses. The projections in this dot-plot suggest higher interest rates for longer, with one more rate rise in 2023 than previously forecast and two less rate cuts in 2024, according to FXStreet analysts.
The NASDAQ Composite, S&P 500 and Dow Jones have all continued their slide after the news.
Nvidia stock news: Partnership with Infosys lifts outlook
Before the market opened, Nvidia announced a new partnership with India's Infosys (INFY). The latter will utilize Nvidia's AI tools and platforms to offer its customers access to various generative AI solutions and integrations.
In other news, on Tuesday UBS released a report on the secondary GPU market. They found that volumes have dropped precipitously, but this appears to be due to a lack of supply. Prices on average ticked up 3% from July.
Nvidia shareholders face possible demand shortfall
As the leading stock in the artificial intelligence (AI) industry based on the supply of its advanced GPUs, Nvidia has garnered an industry-leading valuation. The stock is valued at 45 times forward GAAP earnings. If those profits fail to materialize, then shareholders are always at risk of a profound sell-off.
Consensus earnings are expected to rise 224% this fiscal year, 48% the following year and 25% the year after that. Likewise, revenue is expected to spike 101% this fiscal year, 43% the following year, and 23% the year after that. A lot is then riding on Nvidia’s commercial performance to make this high valuation sensible.
It didn’t help things then that Nvidia’s primary foundry partner, Taiwan Semiconductor (TSM), announced last Friday that it was delaying the delivery of equipment it had previously ordered from suppliers like ASML Holdings (ASML). Management blamed the delay on worries over demand from its customers, which was quite surprising.
Ever since OpenAI released ChatGPT in late 2022, most semiconductor headlines have mostly concerned themselves with lack of supply. Demand was reported to be unquenchable, and rumors abounded of various companies and nations stockpiling Nvidia’s H100 GPUs.
It is possible demand is only receding for Taiwan Semi’s other customers – such as Apple (AAPL) or Advanced Micro Devices – but Nvidia is certainly the foundry’s most famous client. Placing the blame on demand might also be a bait-and-switch tactic, since Taiwan Semiconductor recently shifted its start date for production at its new Arizona foundries by one year to 2025, blaming that delay on lack of manpower.
In other news, the UK’s Competition & Markets Authority released seven principles for regulating artificial intelligence on Monday. The regulatory authority named Nvidia by name as one of the corporations it would be holding discussions with on the matter.
Semiconductor stocks FAQs
What is a semiconductor?
A semiconductor is a term for various types of computer chips. Officially called semiconductor devices, these computer chips rely on semiconductor materials like silicon and gallium arsenide to process the electrical current that produces the modern world of computing. They come in many shapes, sizes, enhancements and configurations such as diodes, transistors and integrated circuits to more complicated applications like DRAM memory, simple processors and even GPUs.
What types of semiconductor companies are there?
First, there are the pure chip designers, such as Nvidia, AMD, Broadcom and Qualcomm. These companies use sophisticated software to design and test chips. Second, there are the equipment manufacturers that provide the machines necessary to build computer chips. These include ASML and Lam Research. Then, there are foundries that manufacture the chips. These include Taiwan Semiconductor and GlobalFoundries. Last of all are the integrated device manufacturers who design their own chips and additionally manufacture themselves. These include Samsung and Intel.
What is Moore’s Law?
It is the observation that the number of transistors in an integrated circuit doubles every two years. The “law” is named after Gordon Moore, who founded Fairchild Semiconductor and later Intel. The doubling is possible due to the shrinking size of process nodes or parts in the computer chip. In 1971 the advanced commercial manufacturing had reached 10 microns in width. In 1987 semiconductor technology had advanced to 800 nanometers in width. By 1999, this process had moved to 180 nanometers. By 2007, the size had dropped to 32 nanometers, and this fell all the way to 3 nanometers in 2022, which is close to the size of human DNA.
How large is the semiconductor industry?
In 2022, the global semiconductor industry had revenues just under $600 billion. In total, the industry shipped 1.15 trillion semiconductor units in 2021. The leading nations involved in the semiconductor supply chain are Taiwan, the United States, China, the Netherlands, South Korea, Japan and Israel.
Nvidia stock forecast
Nvidia has not made a new high since its August 24 earnings spike that immediately sold off. The next rally a week later failed to take, and NVDA has been moving lower ever since. Technically, to end its uptrend that begin this spring, Nvidia stock needs to sink below the August 14 low of $403.11.
Based on the daily chart below, bulls and shareholders alike will hope it stops at the $420 support level that has reinforced price action in several sessions this year. Already trading below the 50-day Simple Moving Average, the 100-day SMA comes next and is currently trading just above $408. Below there is the $400 to $403 demand zone.
On the other hand, a break back above the 50-day SMA will do wonders to re-engage bulls.
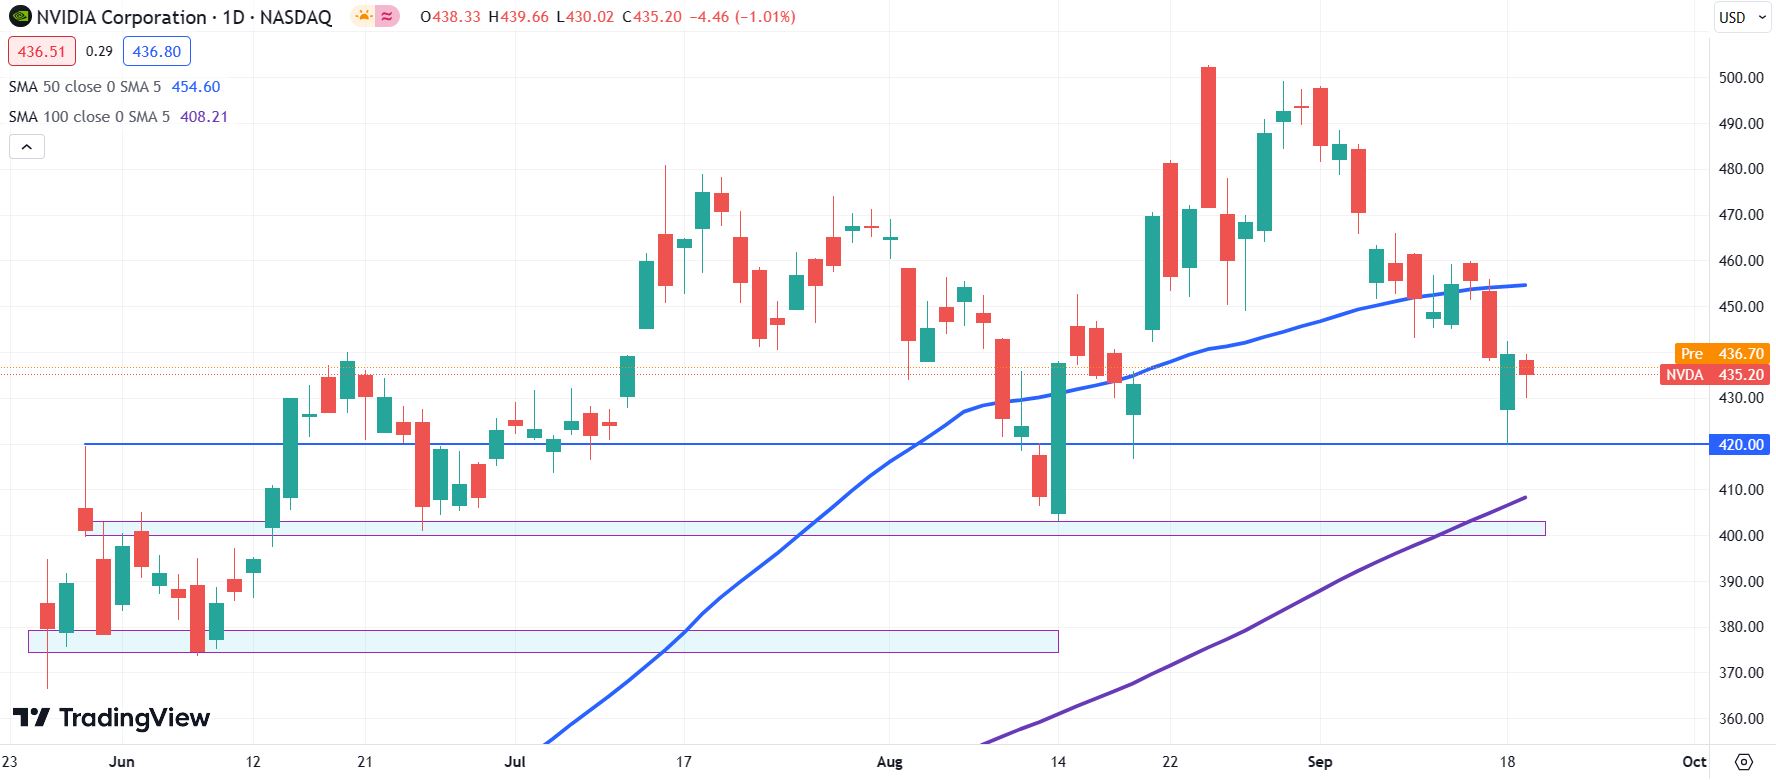
NVDA daily chart
Author

Clay Webster
FXStreet
Clay Webster grew up in the US outside Buffalo, New York and Lancaster, Pennsylvania. He began investing after college following the 2008 financial crisis.


