Nvidia Stock Forecast: NVDA reeling after preliminary earnings disappoint
- Nvidia lowered its estimates for Q2 revenue ahead of schedule.
- The semiconductor said gaming revenue was the primary culprit.
- NVDA stock shed in early Monday trading 6% on the news.

Nvidia (NVDA) is down 6% at $178.55 after the world's premier GPU designer released preliminary second-quarter forecasts that underwhelmed expectations by a mile. The fabless chipmaker is not slated to release Q2 results until August 24, more than two weeks from now, but it probably thought it best to let the market know now that results so far were not in line with earlier projections.
Also read: Nvidia Stock Deep Dive Analysis: NVDA price target at $205 with strong revenue growth
Wall Street consensus had Q2 revenue coming in at $8.1 billion, but the new guidance puts that figure at just $6.7 billion.
“The shortfall relative to the May revenue outlook of $8.10 billion was primarily attributable to lower sell-in of gaming products reflecting a reduction in channel partner sales likely due to macroeconomic headwinds,” Nvidia said in a statement on its website.
The semiconductor also said it was reducing prices with certain partners and that the pricing headwinds may continue into the third quarter. Nvidia now predicts gaming revenue will come in at $2.04 billion, which is exactly $1 billion below earlier analyst consensus and about one-third lower than the quarter one year ago. Besides gaming weakness, the company expects the data center segment to produce sales of about $180 million offer prior consensus.
Nvidia stock forecast
Nvidia stock has already moved toward support at $173, the high from June 27, but is now trying to make its way back up. NVDA is one of those stocks that tend to have a number of players ready to buy the dip. The 21-day moving average is also just below the $173 level, making that support hard to break on the first try.
This forecast is bad, however, and we think it likely that NVDA at least makes a run lower at $156 in the next two weeks. $156 was held up on May 12 and then again in mid-June. Guidance for Q3 on August 24 should then become the leading data point. July 5's low at $140.55 is the long-term support.
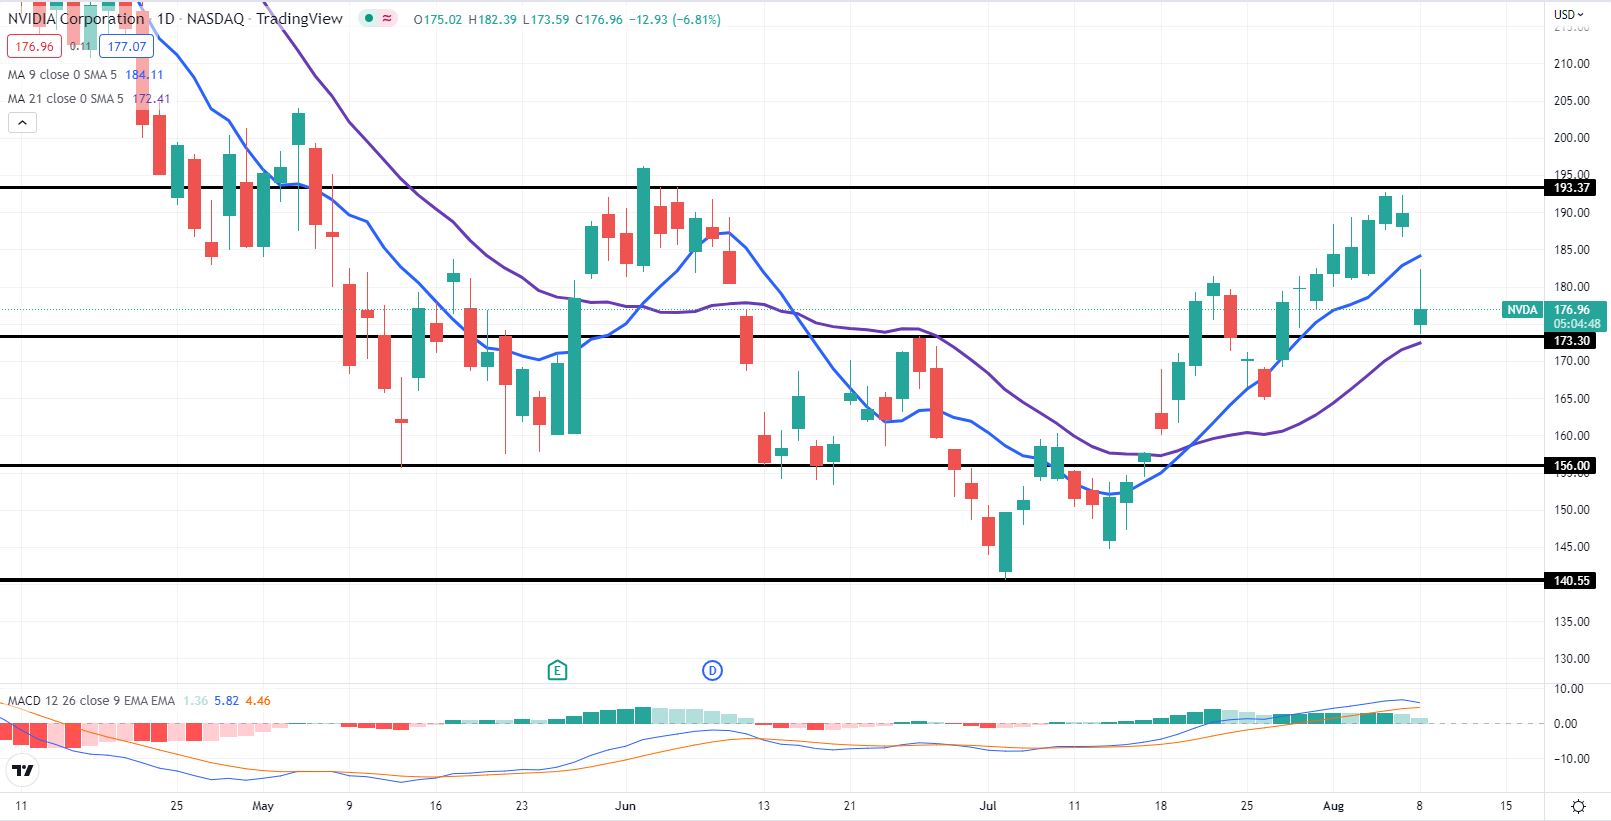
NVDA daily chart
Premium
You have reached your limit of 3 free articles for this month.
Start your subscription and get access to all our original articles.
Author

Clay Webster
FXStreet
Clay Webster grew up in the US outside Buffalo, New York and Lancaster, Pennsylvania. He began investing after college following the 2008 financial crisis.


