Nvidia Stock Deep Dive Analysis: NVDA price target at $205 with strong revenue growth
Nvidia was one of the top-performing stocks in 2021, but the picture has changed in 2022 with the stock falling by nearly 40% year to date. This has been largely due to the shift from growth to value stocks as well as the changing macroeconomic picture. A series of rate hikes from central banks on both sides of the Atlantic have been aggressively priced in by equity markets. Inflation and supply chain issues have also caused a rotational shift from growth to value and from tech to defensive stocks. We surmise that this reduction in Nvidia's stock price presents a more sustainable entry point with risks of a valuation re-rating offset by continued strong revenue growth. We will outline our DCF model with revenue assumptions leading to a fair value share price for Nvidia as well as comparative models versus its peer group and index members.
Contents
Macroeconomic backdrop, market cycle and sector analysis
Executive summary, recommendation and price target
Nvidia: Company overview
Nvidia is part of the global semiconductor industry with operations spanning graphics cards and gaming, automotive applications and data centers. Nvidia was founded in 1993 by three US computer scientists: Jen Hsun Huang, Curtis Priem and Christopher Malachowsky. The initial focus of the company was on the gaming industry with the production of high-end graphics processing units (GPU), which helped power the explosion in gaming culture that took off in the 1990s.
Also read: Apple Stock Deep Dive: AAPL price target at $100 on falling 2023 revenues
The GeForce was the company's first blockbuster gaming card and elevated the company to global prominence. The success of this led to Microsoft selecting Nvidia for its Xbox console. Currently, Nvidia operates across gaming, streaming via GeForce NOW, automotive applications for onboard display and infotainment units, and also provides units for cloud-based applications. The company splits its revenue according to automotive, datacentre applications, gaming and intellectual property, and professional visualizations. Nvidia has invested heavily in the omniverse with 3D virtual worlds and sees this as a key component of its future strategy.
Nvidia has been deriving a significant share of its revenue from Asia. This has been largely due to the growth of manufacturing hubs in Asia as well as the growing Chinese middle class.
| 2022 | 2021 | 2020 | 2019 | 2018 | ||
|---|---|---|---|---|---|---|
| 30-Jan-2022 | 31-Jan-2021 | 26-Jan-2020 | 27-Jan-2019 | 28-Jan-2018 | ||
| China | 26% | 23% | 25% | 24% | 20% | |
| Taiwan | 32% | 27% | 28% | 29% | 31% | |
| Other Asia Pacific | -- | 19% | 25% | 20% | 21% | |
| Europe | -- | 6.7% | 9.1% | 7.8% | 7.9% | |
| United States | 16% | 19% | 8.1% | 13% | 13% | |
| ROW | 26% | 5% | 5.0% | 6% | 7% | |
| Total | 100% | 100% | 100.2% | 100% | 100% |
Source: Refinitiv and FXStreet
Nvidia's revenue by product line, below, shows the dominance of the original gaming sector. However, data center revenue has increased markedly and now rivals gaming. These are the current two main drivers of revenue and will continue to be so over the next three to five years in our view. The omniverse potential remains much harder to quantify, but it retains the chance of being a super catalyst. Recent earnings for cloud peers such as Microsoft and even Amazon via its AWS unit have shown continued strength in the cloud sector. In its last earnings report, Nvidia showed remarkable revenue growth across the data center sphere, running at over an 80% growth rate on a yearly basis. We estimate this makes it likely to be the biggest revenue driver over the next three to five years.
| HISTORICAL (ACTUALS) | FORECAST (MEAN) | |||||
|---|---|---|---|---|---|---|
| FY Jan-20 | FY Jan-21 | FY Jan-22 | FY Jan-23 | FY Jan-24 | FY Jan-25 | |
| INCOME STATEMENT | ||||||
| REVENUE | 10,918 | 16,675 | 26,914 | 33,721 | 39,356 | 45,529 |
| Guidance | T | T | T | T | - | - |
| AUTOMOTIVE | 700 | 536 | 566 | 690 | 998 | 1,163 |
| DATACENTER | 2,983 | 6,696 | 10,613 | 16,918 | 21,448 | 24,568 |
| GAMING | 5,518 | 7,759 | 12,462 | 13,193 | 13,842 | 15,090 |
| OEM AND IP | 505 | 631 | 1,162 | 673 | 654 | 727 |
| PROFESSIONAL VISUALIZATION | 1,212 | 1,053 | 2,111 | 2,616 | 2,916 | 3,314 |
Source: Refinitiv & FXStreet
Nvidia Wall Street consensus forecast
| Analysts Per level | ||||
|---|---|---|---|---|
| 09-Mar-2022 | 09-Apr-2022 | 09-May-2022 | Current | |
| 1 - StrongBuy | 11 | 11 | 11 | 12 |
| 2 - Buy | 29 | 28 | 28 | 29 |
| 3 - Hold | 7 | 8 | 9 | 8 |
| 4 - Sell | 1 | - | - | - |
| 5 - StrongSell | - | - | - | - |
| Rec Mean | 2 | 1.9 | 2 | 1.9 |
| Price Target Summary | ||||
| Price Target | Target | |||
| 09-Mar-2022 | 09-Apr-2022 | 09-May-2022 | Current | |
| Median | $350.00 | $350.00 | $350.00 | $250.00 |
| Mean | $341.17 | $343.03 | $326.46 | $264.52 |
Source: Refinitiv
The Wall Street analyst community remains almost uniformly bullish on Nvidia with only one sell rating and an average price target of $250. At current prices, this gives it a near 40% upside.
Nvidia key valuation metrics
| Market cap $ | 451 billion |
|---|---|
| Enterprise Value | 462 billion |
| EV/EBITDA | 35 |
| Free Float | 2.4 billion |
| IPO date | 22-Jan-99 |
| 52-week high | 346.47 |
| 52-week low | 155.67 |
| Short interest | 1.30% |
| YTD performance | -39% |
| 3-Year performance | 430% |
Source: Refinitic, TradingView, FXStreet
Nvidia peer value comparison
Nvidia was a pandemic darling stock favored by both retail and institutional a like. This has made for some concerning valuation multiples. The price/earnings ratio at 50 is ringing alarm bells, especially compared to Intel's P/E at 7. Even against other more direct peers, NVIDIA does look richly priced. AMD, for example, at a P/E of 38 is still comfortably behind. However, Nvidia boasts the highest margins in the semiconductor space, and revenue is growing exponentially at near 80% annually. The high relative multiple though is one of the key risks going forward, but with revenue growth and margins high NVIDIA should see its P/E reduce without impacting heavily on the share price performance. Indeed, with forward EPS guidance, the P/E for the next twelve months is trading at a more acceptable 31.
| Market Cap | Gross margin | FCF | P/E | EV/EBITDA | P/book | P/Sales | EPS growth rate | ROE | |
|---|---|---|---|---|---|---|---|---|---|
| NVIDIA | $451 billion | 65% | $8 billion | 50 | 34 | 18 | 18 | 22% | 45% |
| Broadcomm | $225 billion | 58% | $14 billion | 28 | 15 | 9 | 9 | 38% | 28% |
| Qualcomm | $153 billion | 59% | $7 billion | 14 | 11 | 15 | 5 | 50% | 113% |
| Intel | $163 billion | 54% | $10 billion | 7 | 5 | 2 | 2 | -45% | 23% |
| AMD | $160 billion | 47% | $3 billion | 38 | 32 | 16 | 8 | 47% | 47% |
| Samsung | $362 billion | 40% | $13 billion | 10 | 4 | 1.5 | 1.5 | 24% | 15% |
| S&P 500 | 20 | ||||||||
| Nasdaq | 25 |
Source: TradingView, Refinitiv and FXStreet
Macroeconomic backdrop, market cycle and sector analysis
The global macroeconomic backdrop continues to look challenging. Supply chain issues remain unresolved, inflation remains elevated, and central banks have begun aggressive monetary tightening. The European Central Bank this week announced rate hikes for the remainder of the year. The Fed is already well down that path with another 50 basis point hike imminent, and the Bank of England has been alarmist about the threat of recession. We write in advance of June's US CPI release. While it may show signs of inflation slowing, the speed of the decline is unlikely to provide much comfort.
Also read: Tesla Stock Deep Dive: Price target at $400 on China headwinds, margin compression, lower deliveries
Naturally, all this has meant equities remain in a challenging environment, and most indices are in bear market territory (defined as a peak to trough decline of 20% or more). The S&P 500 remains in a corrective phase, while the Nasdaq is in a bear market.

Bear markets on average have losses of nearly 40% from peak valuations and an average time span of 300 days. This bear market should have more time to run then – another 20% approximately if it is to meet the historical average. The key question is whether or not the US economy will go into recession in 2023. Bear markets without accompanying recessions are notably less severe with average peak-to-trough declines of 25%.
There is conflicting evidence from headline economic indicators as to the next stage in economic growth. Many forecasters are predicting the US and global recession in the first half of 2023. For now, US data is holding up relatively well. Employment markets remain tight, and workers are exercising their power to negotiate pay raises or are switching jobs. This helps underpin spending, which is a key driver of economic growth. The flip side is that this makes inflation more entrenched. We have also seen some recent upticks in credit card spending, and the personal savings rate has dropped to a decade low. Consumers are using pandemic savings to fuel consumption as well as credit, but as of yet the levels are not concerning.
The pace of change is a factor, and one can say with certainty that US and global economies are slowing. What is less clear is the recession forecast.
Semiconductor sector
The pandemic witnessed a perfect storm of sorts for the chip industry. Stay-at-home demand for work laptops, gaming stations and other PC equipment led to soaring chip demand and resultant shortages. As these bottlenecks unwound, we had continued demand from the aforementioned savings rates and pent-up demand. Semiconductor stocks were some of the best performing names of 2021 as a result. Demand has since flatlined, but supply chain issues have resurfaced meaning chip companies should be able to maintain and increase margins. The majority of chip makers stockpiled in a reactive move to the strong demand witnessed during the pandemic. While this demand may be flatlining, chip makers have inventory available at significantly lower input costs than the current surging inflationary selling costs.
Chip companies face yet another perfect storm, but this time on the supply side of the equation. Russia's invasion of Ukraine has created a shortage of neon gas, which is critical in the production of semiconductor chips. Ukrainian steel plants under Russia's control produce half the world's supply of neon gas. This problem combined with further lockdowns imposed during the month of May in China has led to yet more shortages and fears over chip supply. This has become especially notable in the auto space. Reports have been circulating of auto manufacturers paying double or treble for chips in order to complete a $50,000 vehicle. The reason is scale. A laptop costing $500 requires the same $50 chip that a car costing $50,000 requires to complete its infotainment system or other features. Car companies are then hugely incentivized to outbid other customers for those chips. We expect chip shortages to yet again become an issue but would favor those with higher exposure to the auto sector: Nvidia is not a major supplier to auto companies.
Nvidia latest news and earnings
The latest data from the World Semiconductor Trade Statistics (WSTS) expects the sector to grow 16% in 2022 and a more modest 5% in 2023. Intel (INTC) spoke this week at an investor conference and appeard to talk down projections for the coming quarter, citing multiple headwinds from China to inventory levels.
Despite this downbeat analysis from Intel, NVDA reported earnings on May 25 that showed continued growth in revenue with a beat on EPS and revenue versus Wall Street estimates. Earnings per share (EPS) came in at $1.36 which beat estimates by $0.06 and was nearly 50% higher than previous while revenue growth was also nearing 50% yearly. However, the company sounded a more cautious approach on its outlook given headwinds from China and Russia. Nvidia scaled-back revenue and margins to slightly below Wall Street estimates but despite this NVDA stock did perform strongly post the results.
The reasoning can be seen in the mix of revenue and strong sectoral performance across gaming and data center. Gaming revenues were up 30% yearly while data center revenues rose 83% yearly. NVDA has also taken steps in its adoption of the omniverse as it expects monetization of this space to accelerate in 2023.
Nvidia valuation analysis and fair value
We run a standard DCF and EBITDA valuation model.
| NVIDIA free cash flows | ||||||
|---|---|---|---|---|---|---|
| 2020 | 2021 | 2022 | 2023 | 2024 | 2025 | |
| EBITDA | 4,116 | 7,901 | 13,864 | 17,405 | 20,635 | 26,000 |
| EBIT | 3,735 | 6,803 | 12,690 | 16,019 | 19,144 | 21,689 |
| Tax rate | 7% | 6% | 2% | 12% | 13% | 13% |
| EBIT (1-t) | 3,818 | 7,421 | 13,600 | 15,269 | 18,032 | 22,655 |
| D&A | 381 | 1,098 | 1,174 | 1,302 | 1,304 | 3,138 |
| Change in NWC | -178 | 623 | -12,364 | -6,354 | -11,960 | -15,308 |
| Capital expenditures | 489 | 1,128 | 976 | 1,534 | 1,626 | 1,718 |
| Unlevered free cash flows (UFCF) | 4,510 | 10,270 | 3,386 | 11,751 | 9,001 | 12,202 |
| Free cash flow forecasts | 4,272 | 4,694 | 8,132 | 14,000 | 16,000 | 18,000 |
| Discount rate (r) | 10% | 10% | 10% | 10% | 10% | |
| PV of UFCFs | 9,243 | 3,048 | 10,576 | 8,101 | 10,982 | |
| PV of FCF | 4,225 | 7,319 | 12,600 | 14,400 | 16,200 | |
| Stage 1: Sum of present values | 41,949 | |||||
| Sum of PV using FCF | 54,743 |
| Growth in perpuatiy valuation | Using Forecast FCF | ||||
| growth rate | 10 | 10 | 10 | ||
| 2025 FCF | 13,178 | 19,440 | 17,162 | ||
| termival value in 2025 | 658,911 | 972,000 | 858,075 | ||
| Present Value of Terminal Value | 371,938 | 548,669 | 484,361 | ||
| Enterprise value | 413,887 | 603,412 | 534,812 | ||
| current net debt | - 10,262 | - 10,262 | - 10,262 | ||
| shares outstanding | 2,535 | 2,535 | 2,535 | ||
| equity value | $167 | $242 | $215 | ||
| EBITDA Multiple approach | |||||
| ebitda multiple | 35 | 25 | |||
| terminal value in 2025 | 910,000 | 650,000 | |||
| PV of term value | 513,671 | 366,908 | |||
| ent value | 555,621 | 421,651 | |||
| net debt | 62,928 | 62,928 | |||
| shares outstanding | 2,535 | 2,535 | |||
| equity value | $194 | $142 | |||
Source: Refinitiv and FXStreet calculations
Running the numbers gives us various options to consider. Our main forecast model uses a 10% increase in revenues for 2023 over company forecasts and a resultant increase in margins. This leads us to a DCF price of $242, some $60 above the current NVDA stock price. However, our concern surrounds the high valuation currently placed on the shares. As mentioned NVDA trades on a P/E of 50, too high in our view to be sustainable.
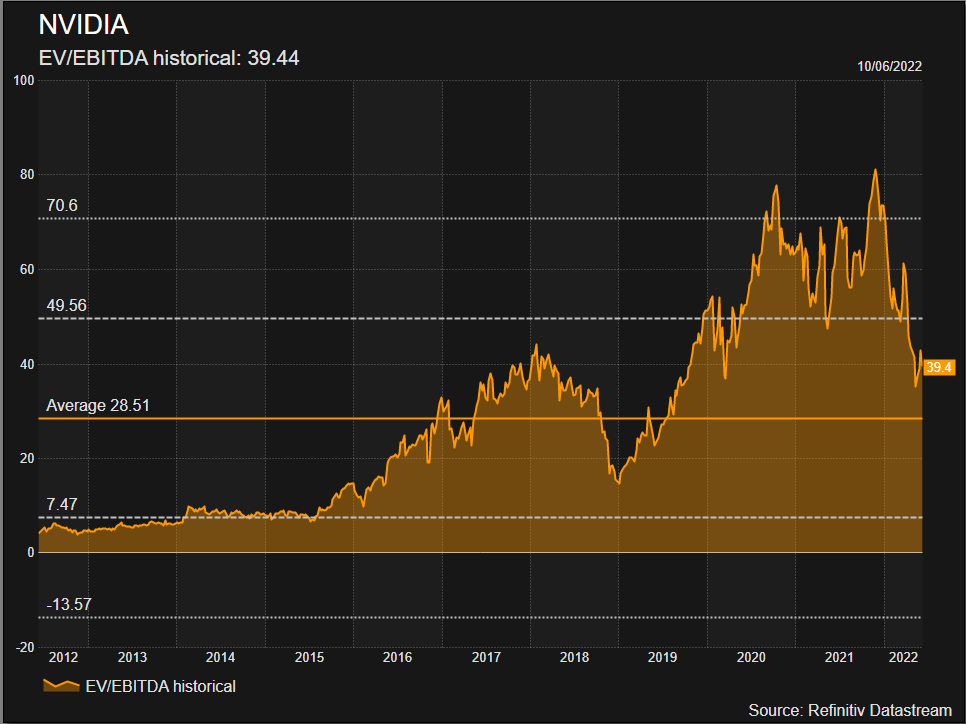
Using the current EV/EBITDA multiple of 35 gives us a fair value of $194, but taking this EV/EBITDA ratio back to 25 gives a lowered price target of $156. This is more in line with sector peers and Nasdaq averages. As we can see below the 10-year average for EV/EBITDA is 28.51 for Nvidia. That would imply a fair value of $162.
It though will likely take some time for Nvidia to rerate to the sector average of 25 but it may settle at 30, giving us a fair price of $172. Combining this with our revenue forecasts gives us our average price target of $207. This obviously represents a premium to the current NVDA stock price and necessitates a BUY rating as a result.
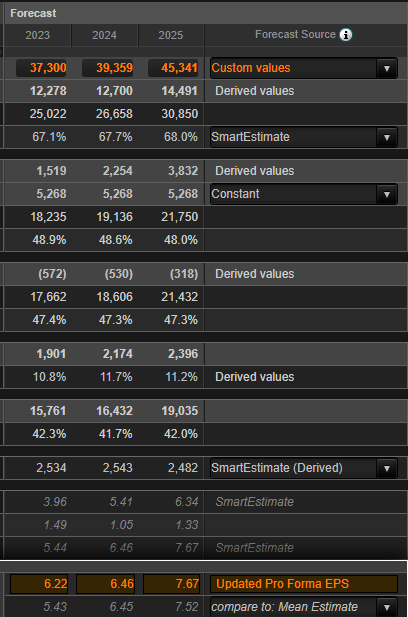
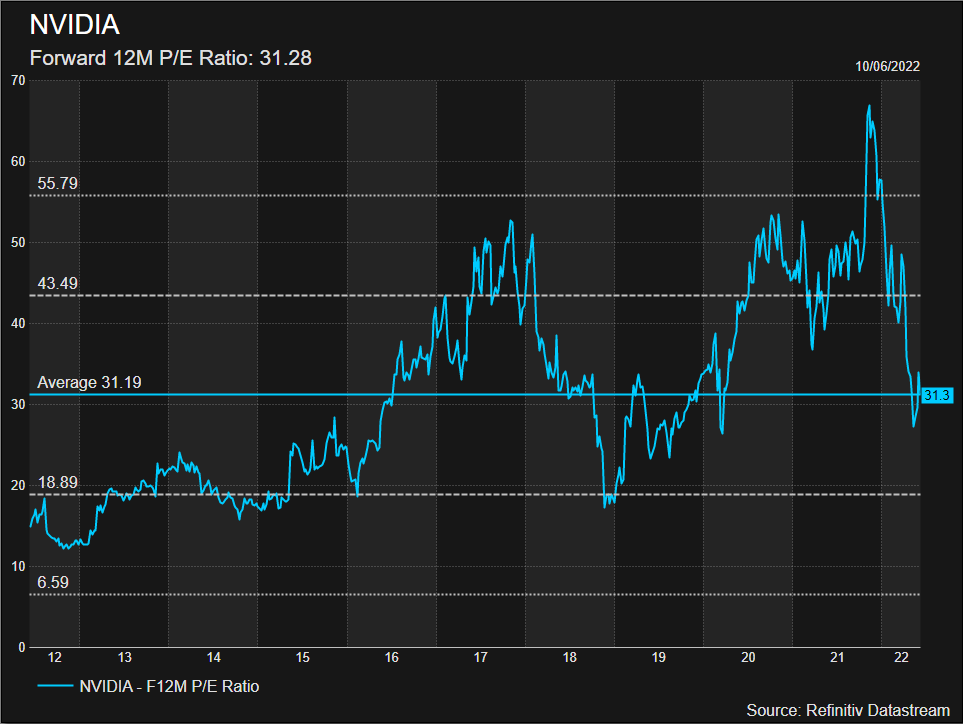
Using the more standardized EPS approach and inputting our updated forecasts gives us EPS guidance of $6.22 for 2023. Trading at 50 times trailing P/E gives a price target of $300 but given we are uncomfortable with such a high P/E this updated EPS still results in a price target of $205 if the P/E falls to 32. The risk as can be seen below is if NVDA falls to the lower end of its historical P/E near 20.
Source: Refinitiv
Based on all the above we run with a 12-month price target of $205 and a BUY rating.
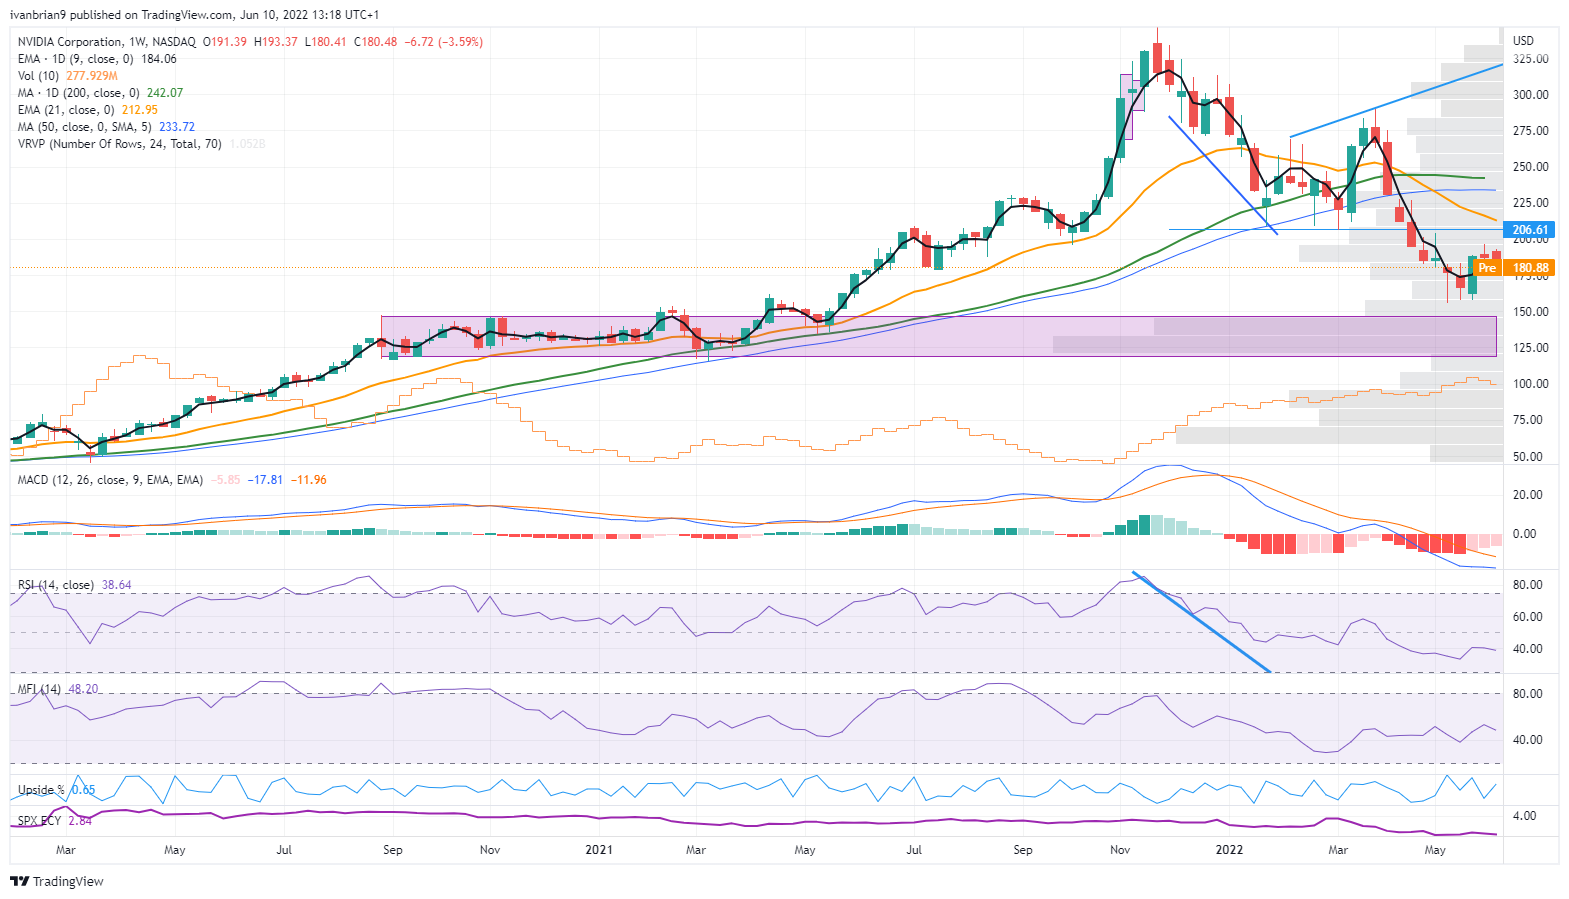
Nvidia technical analysis
How does this fit into the technical viewpoint? There is comforting support at $130 from the huge volume profile and consolidation zone that lasted from August 2020 until April 2021. This breakout was the pandemic-fueled demand combined with chip shortages. As we have highlighted shortages look set to continue. The recent earnings report has seen NVDA stock bottom and $205 looks modest but it is technical resistance at February to April lows.
Nvidia price target and recommendation
The technical picture above gives us some comfort in the event that the downdraft and bear market continues. As detailed above with supply shortages and demand growth remaining strong, NVDA is in a strong position. We believe it has the inventory to cope with current supply issues and demand from the cloud sector will continue as remote working becomes embedded. This creates a permanent uptick in demand for home office, laptop and PC's as well as resultant gaming demand due to more leisure time. This is an immediate event and is not a 5-10 year thesis. The omniverse by comparison is a longer-term thesis and one we largely discounted from any calculation. So there is a form of free bet from the omniverse potential.
Upside risks to our price target
- Supply chain issues accelerate meaning increased price pressure and demand at any price from auto and tech companies.
- Inflation reduces quickly.
- Chinese demand is buoyed from loose monetary policy.
- Omniverse acceleration and monetization.
- Downside risks to our price target
- The bear market continues with high valuation P/E stocks continued selling.
- PC and laptop demand drop sharply as a result of recession and unemployment. The employment market is strong in US but Europe has headwinds.
- Production grinds to a halt due to the neon gas shortage.
Nvidia reported earnings and forecast tables below, the foundation for all our DCF models. Data taken from Refinitiv (Reuters).
| HISTORICAL (ACTUALS) | FORECAST (MEAN) | |||||
|---|---|---|---|---|---|---|
| FY Jan-20 | FY Jan-21 | FY Jan-22 | FY Jan-23 | FY Jan-24 | FY Jan-25 | |
| INCOME STATEMENT | ||||||
| REVENUE | 10918.000 | 16675.000 | 26914.000 | 33720.708 | 39355.898 | 45528.698 |
| Guidance | T | T | T | T | - | - |
| AUTOMOTIVE | 700.000 | 536.000 | 566.000 | 690.436 | 997.627 | 1163.450 |
| DATACENTER | 2983.000 | 6696.000 | 10613.000 | 16918.150 | 21447.925 | 24567.600 |
| GAMING | 5518.000 | 7759.000 | 12462.000 | 13193.075 | 13841.800 | 15089.700 |
| OEM AND IP | 505.000 | 631.000 | 1162.000 | 673.382 | 654.127 | 726.700 |
| PROFESSIONAL VISUALIZATION | 1212.000 | 1053.000 | 2111.000 | 2615.527 | 2915.836 | 3314.200 |
| COST OF GOODS SOLD | 4097.000 | 5728.000 | 8945.000 | 11063.923 | 12806.426 | 14547.100 |
| GROSS INCOME | 6821.000 | 10947.000 | 17969.000 | 22750.100 | 26794.211 | 30748.717 |
| GROSS PROFIT MARGIN | 62.500% | 65.600% | 66.760% | 67.026% | 67.690% | 65.778% |
| Guidance | T | T | T | - | - | - |
| SELLING & MARKETING EXPENSE | - | - | - | 2847.000 | 3627.000 | 4439.000 |
| SG&A EXPENSE | 828.000 | 1089.000 | 1893.000 | 1680.300 | 1940.083 | 2106.250 |
| GENERAL & ADMIN EXPENSE | - | - | 2166.000 | 2895.000 | 3525.000 | 3950.000 |
| R&D EXPENSE | 2289.000 | 3055.000 | 5249.000 | 5488.312 | 6316.627 | 7842.333 |
| STOCK BASED COMPENSATION | 844.000 | 1397.000 | 2004.000 | 2150.500 | 2236.700 | 2347.500 |
| OPERATING EXPENSE | 3086.000 | 4144.000 | 5279.000 | 6962.893 | 7957.456 | 9503.100 |
| Guidance | 3,024:3,080 | 4,100 | 5,139:5,221 | - | - | - |
| EBITDA | 4116.000 | 7901.000 | 13864.000 | 17404.544 | 20635.190 | 23089.071 |
| EBITDA PER SHARE | 1.665 | 3.145 | 5.469 | 5.580 | 6.403 | 5.380 |
| DEPRECIATION | 355.000 | 486.000 | 611.000 | 1141.400 | 1206.800 | 1526.000 |
| EBITA | 2728.000 | 4532.000 | 10041.000 | 10741.000 | 11344.000 | 12020.000 |
| AMORTIZATION | 25.000 | 612.000 | 563.000 | 356.333 | 410.000 | 1391.000 |
| DEPRECIATION & AMORTIZATION | 381.000 | 1098.000 | 1174.000 | 1302.000 | 1303.733 | 3137.500 |
| EBIT | 3735.000 | 6803.000 | 12690.000 | 16019.194 | 19143.624 | 21689.011 |
| OPERATING PROFIT | - | 4532.000 | - | 12086.317 | 11548.200 | - |
| INTEREST EXPENSE | 52.000 | 184.000 | 236.000 | 229.765 | 223.688 | 246.333 |
| PRE-TAX PROFIT | 3860.000 | 6683.000 | 12494.000 | 15062.152 | 18292.946 | 20465.648 |
| TAX PROVISION | 280.000 | 406.000 | 189.000 | 1883.173 | 2299.192 | 2634.783 |
| TAX RATE | 7.250% | 6.080% | 1.901% | 12.270% | 12.617% | 12.867% |
| NET INCOME | 3580.000 | 6277.000 | 11259.000 | 13771.766 | 16442.788 | 18890.257 |
| NUMBER OF SHARES OUTSTANDING | 2472.000 | 2512.000 | 2535.000 | 2545.939 | 2545.969 | 2612.566 |
| EARNINGS PER SHARE | 1.448 | 2.500 | 4.440 | 5.430 | 6.448 | 7.523 |
| EBITDA REPORTED | 3227.000 | 6041.000 | 11860.000 | 13952.000 | 16273.033 | 17144.865 |
| PRE-TAX PROFIT REPORTED | 2970.000 | 4409.000 | 9941.000 | 10489.767 | 14498.144 | 18797.066 |
| NET INCOME REPORTED | 2796.000 | 4332.000 | 9752.000 | 9971.386 | 13776.212 | 15991.441 |
| EARNINGS PER SHARE REPORTED | 1.130 | 1.725 | 3.850 | 3.960 | 5.431 | 6.348 |
| DIVIDEND PER SHARE | 0.160 | 0.160 | - | 0.175 | 0.233 | 0.200 |
| Guidance | T | - | - | - | - | - |
| BALANCE SHEET | ||||||
| CASH AND CASH EQUIVALENTS | 10896.000 | 847.000 | 1990.000 | 17750.847 | 27758.687 | 25785.000 |
| INVENTORY | 979.000 | 1826.000 | 2605.000 | 2970.894 | 3391.938 | 4117.000 |
| CURRENT ASSETS | 13690.000 | 16055.000 | 28829.000 | 36284.263 | 48378.400 | 65243.500 |
| TOTAL ASSETS | 17315.000 | 28791.000 | 44187.000 | 51812.619 | 64515.388 | 81997.500 |
| CURRENT LIABILITIES | 1784.000 | 3925.000 | 4335.000 | 5436.663 | 5570.307 | 7127.000 |
| CURRENT DEFERRED REVENUE | 141.000 | 288.000 | 300.000 | 2552.000 | 2552.000 | - |
| TOTAL DEBT | 1991.000 | 6963.000 | 10946.000 | 10946.500 | 10946.500 | - |
| NET DEBT | -8906.000 | 6116.000 | -10262.000 | -15275.726 | -21666.297 | -26814.472 |
| SHAREHOLDERS EQUITY | 12204.000 | 16893.000 | 26612.000 | 33893.982 | 45418.682 | 54473.863 |
| GOODWILL | 618.000 | 4193.000 | 4349.000 | 4347.909 | 4347.909 | 4365.000 |
| NET ASSET VALUE | 12204.000 | 16893.000 | 26612.000 | 32997.888 | 44388.729 | 51557.000 |
| BOOK VALUE PER SHARE | 4.985 | 6.813 | 10.645 | 13.420 | 17.467 | 19.283 |
| TANGIBLE BOOK VALUE PER SHARE | 4.713 | 4.018 | 7.970 | 11.583 | 16.968 | - |
| ENTERPRISE VALUE | 133273.840 | 328261.800 | 610458.100 | 440116.927 | 432357.433 | 426161.656 |
| TANGIBLE BOOK VALUE | 11537.000 | 9963.000 | 19924.000 | 27104.085 | 38030.482 | - |
| CASH FLOW STATEMENT | ||||||
| NET WORKING CAPITAL | 11906.000 | 12130.000 | 24494.000 | - | - | - |
| INCOME TAXES PAID | 176.000 | 249.000 | 396.000 | - | - | - |
| CASH FLOW FROM OPERATIONS | 4761.000 | 5822.000 | 9108.000 | 13437.947 | 16799.471 | 18863.833 |
| CAPITAL EXPENDITURES | 489.000 | 1128.000 | 976.000 | 1533.649 | 1626.453 | 1718.288 |
| CASH FLOW FROM INVESTING | 6145.000 | -19675.000 | -9830.000 | -65.167 | -2215.000 | -4795.500 |
| FREE CASH FLOW | 4272.000 | 4694.000 | 8132.000 | 12192.153 | 15147.902 | 15890.278 |
| FREE CASH FLOW PER SHARE | 1.720 | 1.868 | 3.210 | 4.878 | 6.302 | 5.645 |
| TOTAL DIVIDENDS | 390.000 | 395.000 | 399.000 | 567.656 | 630.989 | 395.000 |
| CASH FLOW FROM FINANCING | -792.000 | 3804.000 | 1865.000 | -6149.492 | -6162.990 | -3943.000 |
| CASH FLOW PER SHARE | 1.925 | 2.318 | 3.590 | 5.672 | 6.555 | 7.330 |
| VALUATION METRICS | ||||||
| RETURN ON ASSETS | 23.390% | 27.230% | 30.859% | 25.989% | 33.445% | - |
| RETURN ON EQUITY | 33.230% | 77.830% | 51.759% | 39.932% | 42.342% | 42.610% |
| RETURN ON CAPITAL EMPLOYED | 24.050% | 27.360% | 31.839% | 28.400% | 28.000% | - |
| RETURN ON INVESTED CAPITAL | 104.760% | 52.030% | 77.614% | 38.945% | 43.815% | 22.510% |
| PRICE/SALES RATIO | - | - | 19.300% | 14.290% | 14.050% | 12.970% |
Like this article? Help us with some feedback by answering this survey:
Author

Ivan Brian
FXStreet
Ivan Brian started his career with AIB Bank in corporate finance and then worked for seven years at Baxter. He started as a macro analyst before becoming Head of Research and then CFO.