Nvidia (NVDA) stock advances despite earnings miss
- NVDA stock gains more than 2% after hours following Q3 earnings.
- Nvidia missed non-GAAP EPS consensus by 17%.
- Management expects Q4 revenue to be higher than Q3.
Nvidia (NVDA) stock gained 2.2% to $162.60 late Wednesday despite the fact that the premier chip designer in the world missed the Wall Street non-GAAP line of $0.70 a share. Adjusted earnings per share (EPS) actually came in more than 17% below consensus at $0.52.
"Why the advance for Nvidia price then?" you ask. It pretty much comes down to revenues. The market was expecting a third poor quarter in a row on the revenue front, but Nvidia emerged in Q3 with $5.93 billion. This was about $115 million ahead of the Street's average forecast.
Nvidia earnings news
The real silver lining, if you want to call it that, is that management pushed revenue expectations for Q4 higher than the present. Nvidia sales have been in a freefall for most of 2022 as many crypto miners have gone belly-up in the face of falling crypto prices and stopped buying their usual allotment of GPUs. Management, however, guided for $6 billion in Q4 sales, adding that the range was just 2% above or below that figure. The top line of that range at $6.12 billion was still about $20 million below the earlier analyst consensus, but the market has been optimistic this week.
Much of that optimism is spillover from inflation data coming in soft and the US Midterm Elections having passed, but the market seems to believe that the worst is over for the semiconductor giant. Though Nvidia's share price remains down 47% year to date, NVDA stock has charged forward more than 35% in the past month. This does seem somewhat surprising, seeing as revenue is down about 17% YoY and EPS in Q3 was down by more than half over that same time period.
Management's guidance for gross margin, however, also turned heads. Despite finishing the third quarter with a 56.1% adjusted gross margin, the executive said it would hit 66% in the fourth quarter. This signals to shareholders that notwithstanding the higher inventory levels reducing demand this year, Nvidia is not even close to being a price taker.
While the gaming segment continues to deteriorate, down 51% YoY, data center revenue continued to outperform. Sales from that segment rose 31% YoY despite softness in China stemming from covid lockdowns. A big reason for its fall in gross margin during the quarter was a $700+ million charge caused by this lower demand from Chinese data centers.
Executives said the inability to sell its A100 and H100 data center processors to Chinese customers due to ongoing US sanctions also hurt results, but that Chinese customers instead chose to bulk up on other products.
"We’re seeing surging demand in some very important sectors of AIs and important breakthroughs in AI," said CEO Jensen Huang, while noting that demand for general-purpose computing chips had slowed. "One is called deep recommender systems, which is quite essential now to the best content or item or product to recommend to somebody who’s using a device that is like a cell phone or interacting with a computer just using voice."
Nvidia stock forecast
Nvidia stock is beginning to trade lower in Thursday's premarket, however, alongside the broad market. Shares are off 1.4% in line with the Nasdaq Composite, so this does not seem to be a result of Nvidia's earnings. The major event has been St. Louis Federal Reserve President James Bullard saying that a "doveish" Fed policy from this point would still require a full one percentage point hike to the fed funds rate.
If the market does seek support, NVDA stock can find it at the 9-day moving average near $153. A more drastic sell-off could force it down to the 21-day average at $140. For bulls to come back into this name, Nvidia stock needs to break above the Tuesday high at $170. The Moving Average Convergence Divergence (MACD) is still in a bullish crossover stance, but it has begun to move sideways.
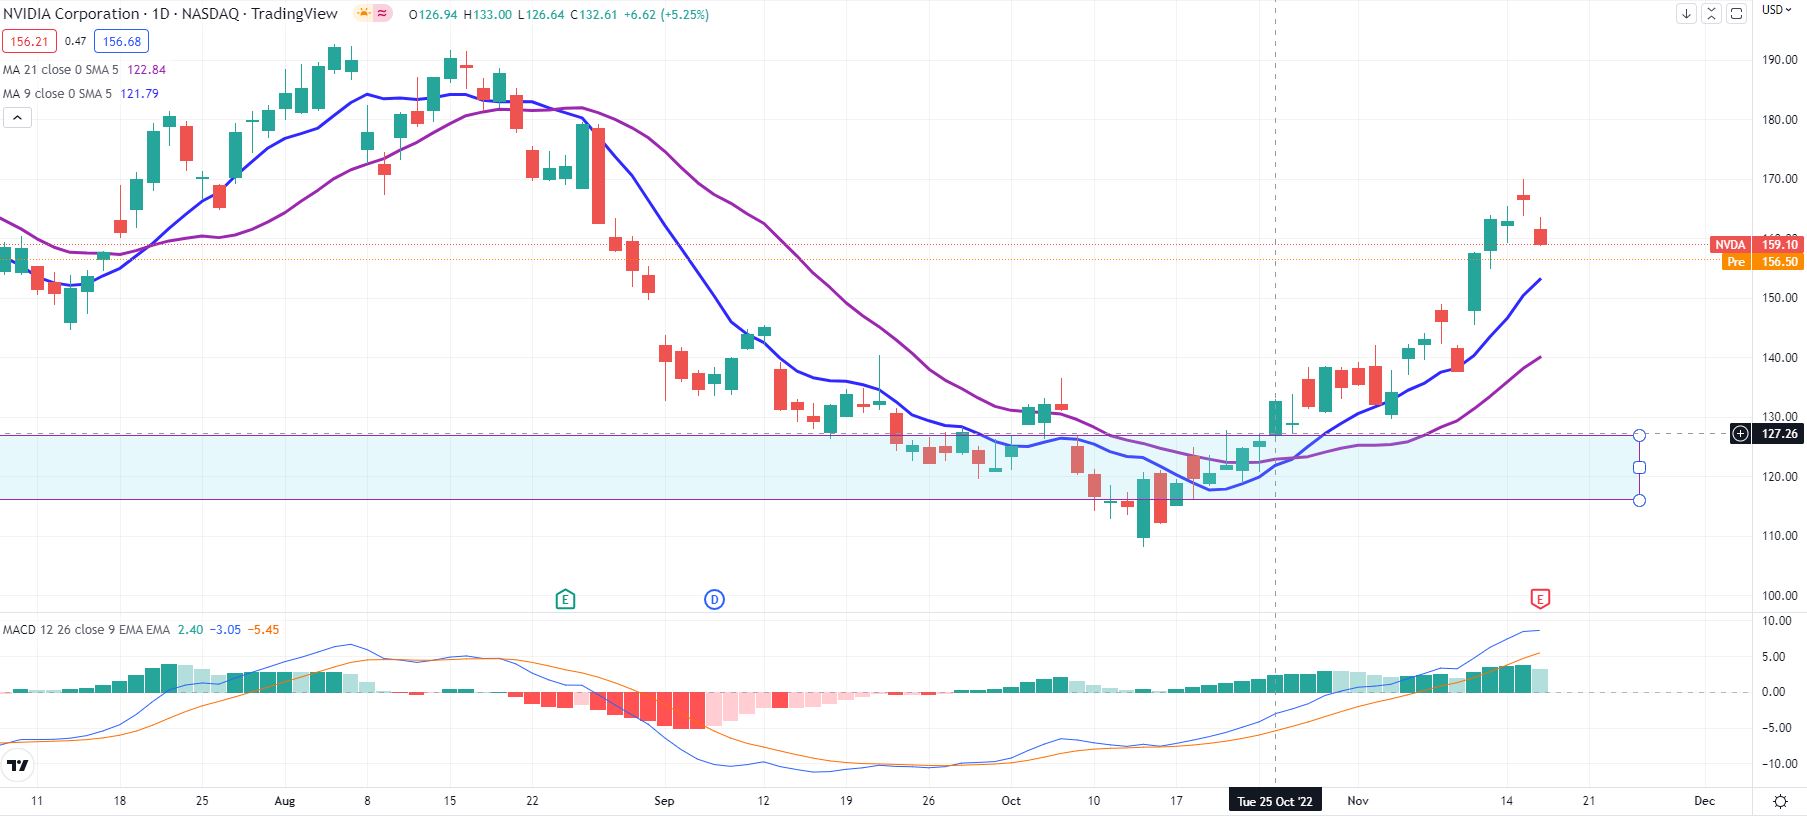
NVDA 1-day chart
Premium
You have reached your limit of 3 free articles for this month.
Start your subscription and get access to all our original articles.
Author

Clay Webster
FXStreet
Clay Webster grew up in the US outside Buffalo, New York and Lancaster, Pennsylvania. He began investing after college following the 2008 financial crisis.


