Neutral is a position, and Las Vegas is an indicator

We've been relentlessly stubborn in our bullish equity stance for months and thus far the markets have managed to behave as the charts suggested they would. However, we are pausing to see how price action resolves itself in the short run; being neutral is a position. With both the NASDAQ 100 and the S&P 500 battling at significant technical levels, having a nimble attitude is desirable. When it comes to markets, positions are to be courted, not married.
In late April, we issued a newsletter arguing that bearish positioning by speculators and under-allocation to equities in traditional portfolios could fuel a stock market rally. We also pointed out that seasonality has shifted recently; "sell in May" hasn't worked for a while, and low-volume summer rallies are now the norm. Further, the S&P has found buyers on all dips into significant support levels, and, lastly, commodity inflation has flipped into deflationary territory. All these stock market supportive premises remain valid. In fact, at least one has become even more compelling; speculators have added to their net short futures position in the E-mini S&P 500 despite the index rally. In other words, the rally has not been the result of short covering; it has occurred despite some shorts being put through the spin cycle.
The latest COT Report (Commitment of Traders) issued by the CFTC (Commodity Futures Trading Commission) revealed that large speculators are holding a net short position of nearly 440,000 contracts. According to the information available to me, this is the most prominent bearish position ever held in the E-mini S&P 500 futures!
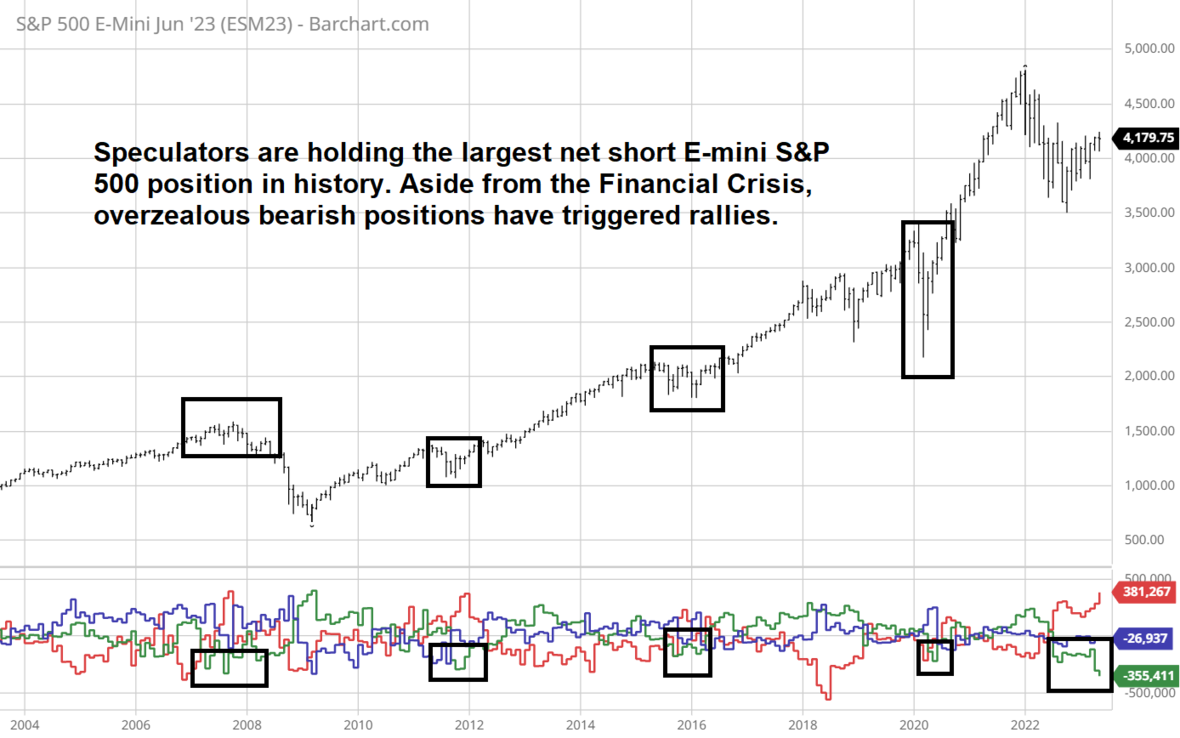
Speculators that fall into the large speculator category of the COT Report either have a lot of money, a significant position, or both; consequently, they are often referred to as the "smart money." The assumption is that less-than-smart people don't have access to such things, but that conventional thinking isn't necessarily accurate. Often, when the "smart money" accumulates an overcrowded trade of this caliber, it is a contrarian indicator. This is because if big players are bearish and have already expressed that opinion in the markets, there might not be anyone left to sell. Like any market clue, there are no free lunches, but this general hypothesis has proven helpful more often than not.
We've read some analysis that suggests the net short position in stock index futures is "different this time." Instead of being a traditional contrarian indicator, these analysts believe the large bearish position is a sign of things to come. They argue the massive net short position exists because the "smart money" is establishing aggressive risk hedges (ie. selling futures against their stock market holdings). Nevertheless, even if most of the net short position in the futures markets is a portfolio hedge, that hedge will need to be unwound, just like a speculative short would be. It is well known that most stock market gains occur in the overnight session. This is no coincidence; overnight futures trading does impact prices on the NYSE open.
Another antagonistic argument we have encountered upon pointing out the record net short futures position is the fact that futures market participation today is wildly higher than it was 20 years ago, or even 10 years ago. Thus, some believe the market is bigger, therefore, the net position can be bigger without necessarily being indicative of an overcrowded trade. There is some truth to this, but I would argue that margin requirements are much higher now than at almost any other point in history. Higher margins and more risk (a 10% move with the S&P 500 at 4000 is much larger than the same percentage move when the market was at 2000), act as a deterrent for larger contract sizes. In short, the size of the net position (longs vs. shorts) isn't going unchecked. Thus, we side with the theory that the historically large net short position will put a floor under the market and, eventually, propel it higher. Despite all the fundamental stories we use to justify price changes, in the end, the markets can't go down if there are more buyers than sellers.
Economists have been ringing the recession bell for over a year now. We are seeing some softness in data, but what if central bankers pumped so much liquidity into the system in the aftermath of Covid that their recent efforts to reign that liquidity in have been mostly futile? In my unscientific observations, I believe that is precisely what is happening. I live in what some might consider the capital of discretionary spending, Las Vegas. I don't recall a time our city was busier than it is now. It isn't easy to get into restaurants, shows, and sporting events, and even if you can get into any of these things, the prices are substantially more than just a few years ago. Yet, people are begging to pay for the experience. I've been fortunate to have done some traveling to other areas of the country, and even abroad, in 2023, and I've witnessed the same euphoric spending everywhere I go. We don't know when the game of musical chairs will stop, but for now the economy is surviving anything the Fed throws at it.
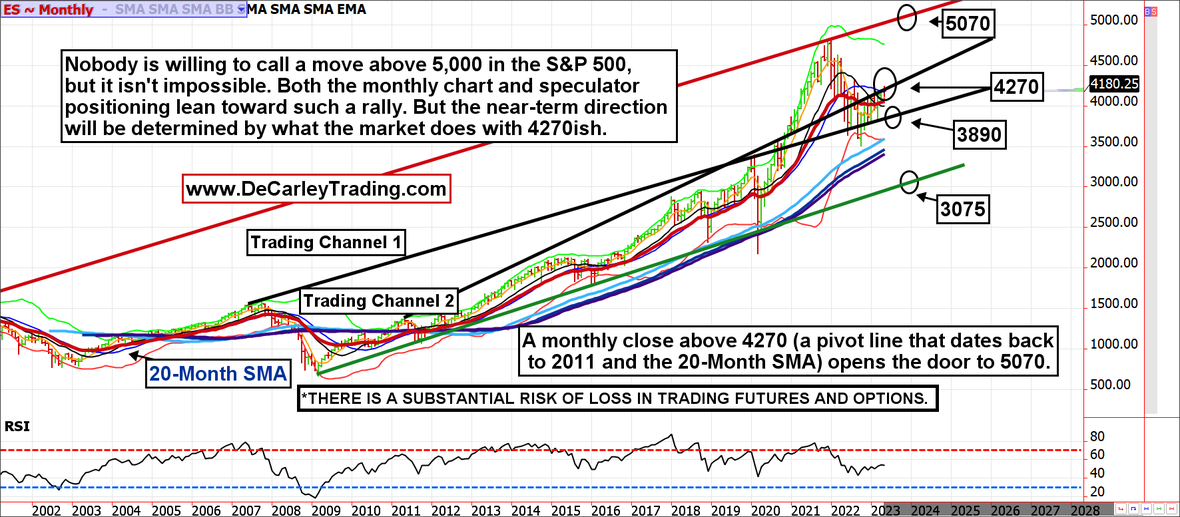
I'm naturally an optimistic person, and I believe all the aforementioned points will eventually result in higher equities, but I'm also a chart follower. A monthly chart of the S&P 500 depicts a clear pivot price near 4270. Corrections from this level can be fierce and are relatively probable. Thus, it is prudent to take a step back, shore up downside risk, and see how things unfold.
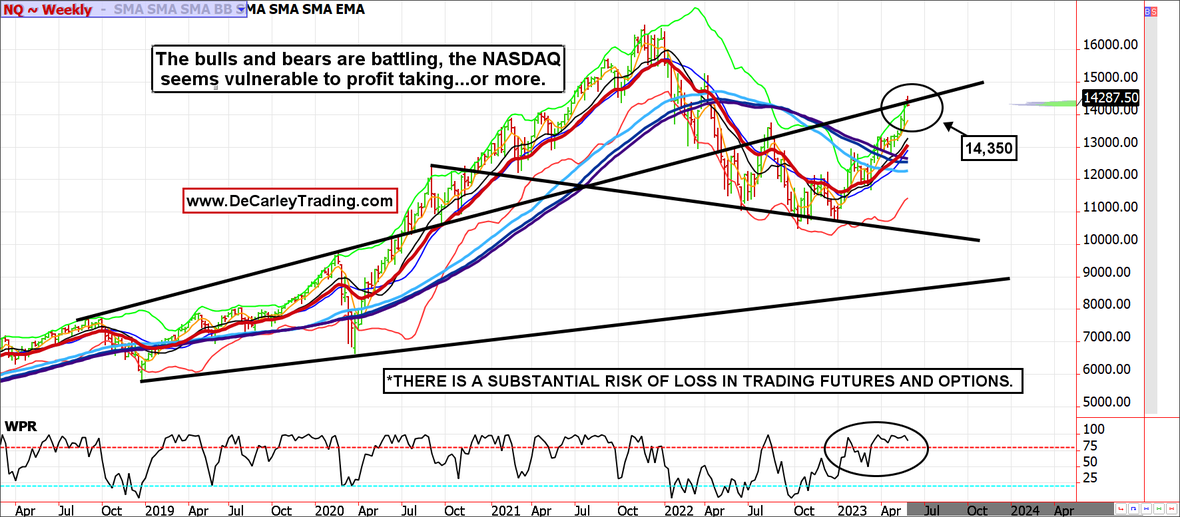
NASDAQ followers might take heed to the weekly chart depicting 14,350 as a battleground for bulls and bears. Prices could start to get heavy from here.
In the long run, stocks have always managed to go up, but it is the short run that sneaks up on complacent investors. Portfolio hedges such as risk reversals are probably a good idea from these levels. For instance, it is possible to sell a September 4400 call in the E-mini S&P 500 for about 55.00 points and then use the proceeds to buy a 3875 put for about the same amount of premium. This results in a free, or at least meager cost, hedge in which a portfolio is giving up gains over 4400 the next 107 days over in exchange for complete protection under 3875.
**There is substantial risk of loss in trading futures and options. There are no guarantees in speculation; most people lose money trading commodities. Past performance is not indicative of future results.
Seasonality is already factored into current prices, any references to such does not indicate future market action.
These recommendations are a solicitation for entering into derivatives transactions. All known news and events have already been factored into the price of the underlying derivatives discussed. From time to time persons affiliated with Zaner, or its associated companies, may have positions in recommended and other derivatives. Past performance is not indicative of future results. The information and data in this report were obtained from sources considered reliable. Their accuracy or completeness is not guaranteed. Any decision to purchase or sell as a result of the opinions expressed in this report will be the full responsibility of the person authorizing such transaction. Seasonal tendencies are a composite of some of the more consistent commodity futures seasonals that have occurred over the past 15 or more years. There are usually underlying, fundamental circumstances that occur annually that tend to cause the futures markets to react in similar directional manner during a certain calendar year. While seasonal trends may potentially impact supply and demand in certain commodities, seasonal aspects of supply and demand have been factored into futures & options market pricing. Even if a seasonal tendency occurs in the future, it may not result in a profitable transaction as fees and the timing of the entry and liquidation may impact on the results. No representation is being made that any account has in the past, or will in the future, achieve profits using these recommendations. No representation is being made that price patterns will recur in the future.
Author

Carley Garner
DeCarley Trading
Carley Garner is an experienced commodity broker with DeCarley Trading, a division of Zaner, in Las Vegas, Nevada. She is also the author of multiple books including, “Higher Probability Commodity Trading” and “A Trader's First Book on Commodities”.


