Natural Gas holds on to gains while US Dollar flirts with key level
- Natural Gas prices are soaring towards $2.00 at the start of the week.
- Traders are trading prospects of supply side set diminish by 4%.
- The US Dollar Index is stuck in a ‘push and pull’ pattern with the Fed pushing against markets’ expectations for fewer rate cuts.

Natural Gas (XNG/USD) price soars higher on Tuesday after a stellar performance on Monday, trading up nearly 3% for the week. The move comes as Bloomberg forecasts a decline in Gas supply by 4% in the coming weeks as Egypt is looking to hoard gas exports to keep for its own energy consumption. With the hot season nearing in the region, air conditioning and cooling installations are draining the energy grid and are in need of more electricity, which Egypt gets partially from its Gas-burning installations.
The DXY US Dollar Index, meanwhile, had a soft start of the week, though keeping afloat around 104.00. Markets are digesting rather positive US data that points to a healthy and steady US economy, while US Federal Reserve (Fed) officials keep pushing back against market expectations by saying that rate cuts are coming soon. This keeps traders sidelined and puts the US Dollar Index in a sideways pattern of just 3% volatility from top to bottom, for the better part of 2024.
Natural Gas is trading at $2.01 per MMBtu at the time of writing.
Natural Gas news and market movers: Supplier set to hoard gas
- Bloomberg Intelligence forecasts the Gas supply side is set to drop by 4%, or 34.5 million metric tons, in the coming weeks as Egypt bans its Gas exports to use it for its own electricity needs. This coincides with the beginning of the summer season, when the demand for electricity increases to power air conditioners.
- Dow Jones reports that BP will see a higher profit for this quarter with gas and oil prices picking up.
- Recent lower prices in European Gas markets are seeing heavy buying, pushing up prices locally and could see more chunky buying out of Asia.
Natural Gas Technical Analysis: Energy needs are picking up
Natural Gas prices are soaring this week with traders seeing a change in the supply side after Bloomberg reported Egypt might end its exports over the summer. Markets are facing the possibility of lower supply for the same amount of demand, or even increased demand as the European market is under siege from Asian trading desks buying up cheap Gas contracts. This combination could lead to a significant rise in prices ahead
On the upside, the key $1.97 level needs to be regained before challenging last week’s peak at $2.01. The next key mark is the historic pivotal point at $2.13. Should Gas prices pop up in that region, a broad area opens up with the first cap at the red descending trend line near $2.21.
On the downside, multi-year lows at $1.60 are still nearby, with $1.65 as the first line in the sand. In case of a breakdown below these levels, traders should look at $1.53 as the next supportive area.
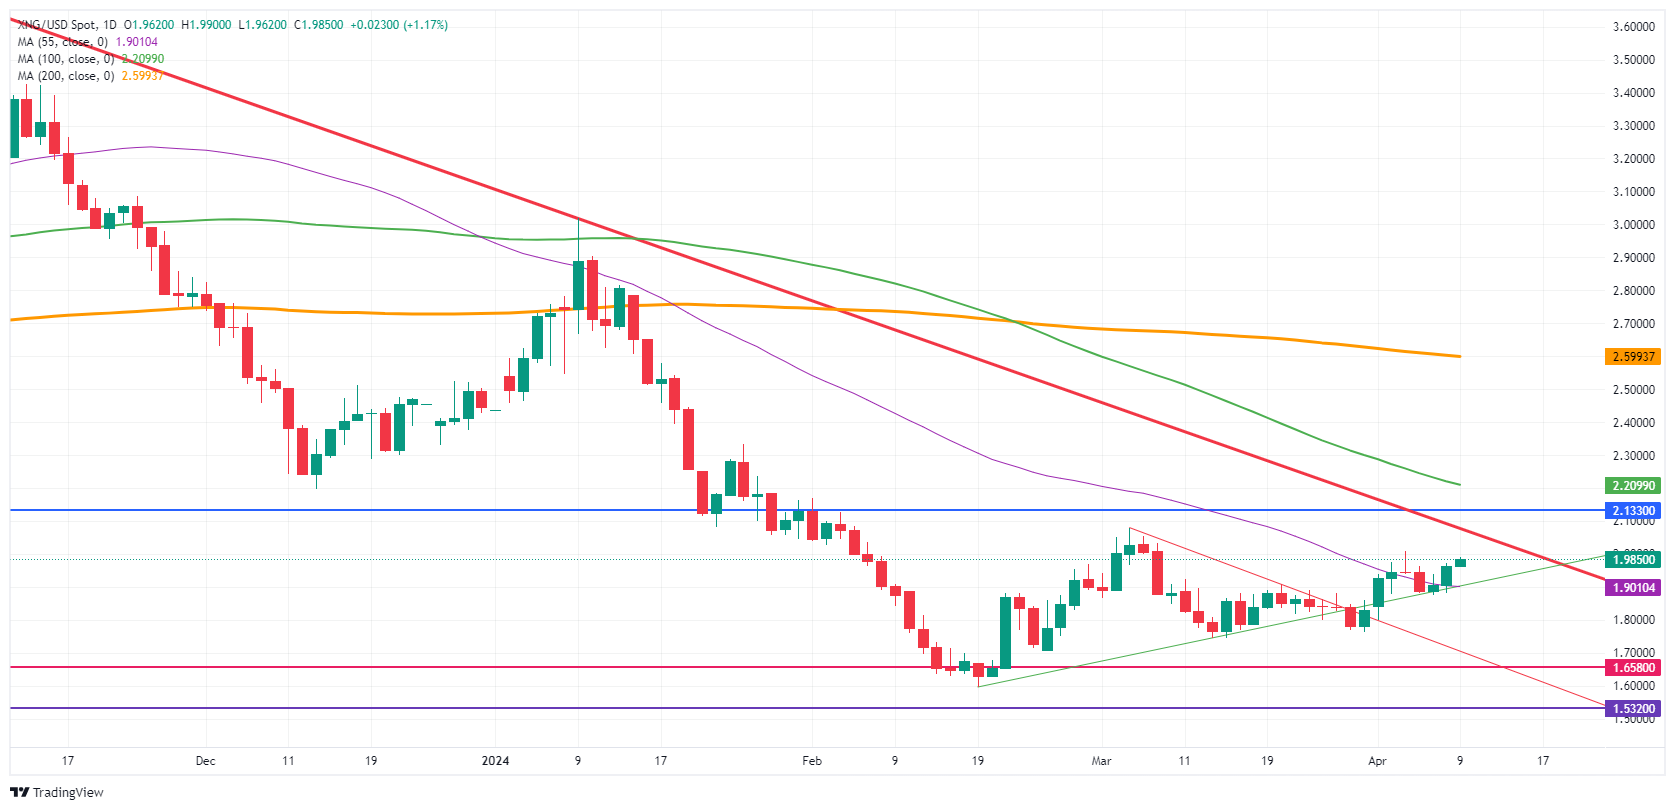
Natural Gas: Daily Chart
Natural Gas FAQs
Supply and demand dynamics are a key factor influencing Natural Gas prices, and are themselves influenced by global economic growth, industrial activity, population growth, production levels, and inventories. The weather impacts Natural Gas prices because more Gas is used during cold winters and hot summers for heating and cooling. Competition from other energy sources impacts prices as consumers may switch to cheaper sources. Geopolitical events are factors as exemplified by the war in Ukraine. Government policies relating to extraction, transportation, and environmental issues also impact prices.
The main economic release influencing Natural Gas prices is the weekly inventory bulletin from the Energy Information Administration (EIA), a US government agency that produces US gas market data. The EIA Gas bulletin usually comes out on Thursday at 14:30 GMT, a day after the EIA publishes its weekly Oil bulletin. Economic data from large consumers of Natural Gas can impact supply and demand, the largest of which include China, Germany and Japan. Natural Gas is primarily priced and traded in US Dollars, thus economic releases impacting the US Dollar are also factors.
The US Dollar is the world’s reserve currency and most commodities, including Natural Gas are priced and traded on international markets in US Dollars. As such, the value of the US Dollar is a factor in the price of Natural Gas, because if the Dollar strengthens it means less Dollars are required to buy the same volume of Gas (the price falls), and vice versa if USD strengthens.
Author

Filip Lagaart
FXStreet
Filip Lagaart is a former sales/trader with over 15 years of financial markets expertise under its belt.


