Natural Gas steady with summer season facing ample amount of demand
- Natural Gas price holds ground above $2.00 on Friday.
- Gas prices are likely to tick up in the coming weeks as European traders start to prepare for the next winter season.
- The US Dollar Index steady in the green, though not enough to erase the weekly loss.

Natural Gas (XNG/USD) prices are holding ground above $2.00 on Friday after a brief dip earlier this week. Gas prices are quickly recovering as mainland Europe is gearing up for the next heating season, with traders starting to negotiate contracts in order to refuel ahead of next winter. Even though European Gas reserves are still at 61%, traders are issuing concerns that the volume of pre-agreed contracts is too little to get strategic reserves back to their near-full levels seen last September, which means more short-term and more expensive handling could occur.
Meanwhile, the US Dollar Index (DXY), is in the green and is entering a calm patch for the end of this week. Despite the uptick for this Friday, the move will not be enough to avoid a negative weekly performance for the DXY for a second week in a row. The retreat comes with current economic numbers pointing to rather stagflation than US exceptionalism. More data though is needed to confirm the one or the other.
Natural Gas is trading at $2.03 per MMBtu at the time of writing.
Natural Gas news and market movers: European demand for the summer
- The UK is building Europe’s biggest Liquified Natural Gas (LNG) storage, which will be operational in 2025.
- Bloomberg data shows that Qatar is the main deliverer for European Gas, filling in the gap from Russia.
- TotalEnergies SE has reported a smaller-than-expected drop in its first-quarter profit, with elevated Oil prices offsetting the recent crash in Gas prices.
Natural Gas Technical Analysis: Steady in support
Natural Gas could be entering in a rather steady uptrend, with the demand side from mainland Europe and the UK starting to take in deliveries for restocking ahead of this year’s fall and winter. Subsequently, continuous demand will be present during the spring and summer periods. Meanwhile, on the supply side, Norway and the US have had substantial delivery issues due to unforeseen maintenance and outages in certain LNG facilities. Any further disruptions could trigger a shot higher, with Gas prices heading to $2.50 over the summer.
On the upside, the blue line at $2.11, the 2023 low, and the 100-day Simple Moving Average (SMA) at $2.10 are acting as a resistance. Further up, the next level to watch is the January 25 high at $2.33.
On the other side, the $2.00 handle has worked as nearby support for now. Further down, a trifecta of support is formed at $1.88, with the ascending and descending trend lines crossing and the 55-day SMA. Should that level break, expect a quick downward movement to the year-to-date low at $1.60.
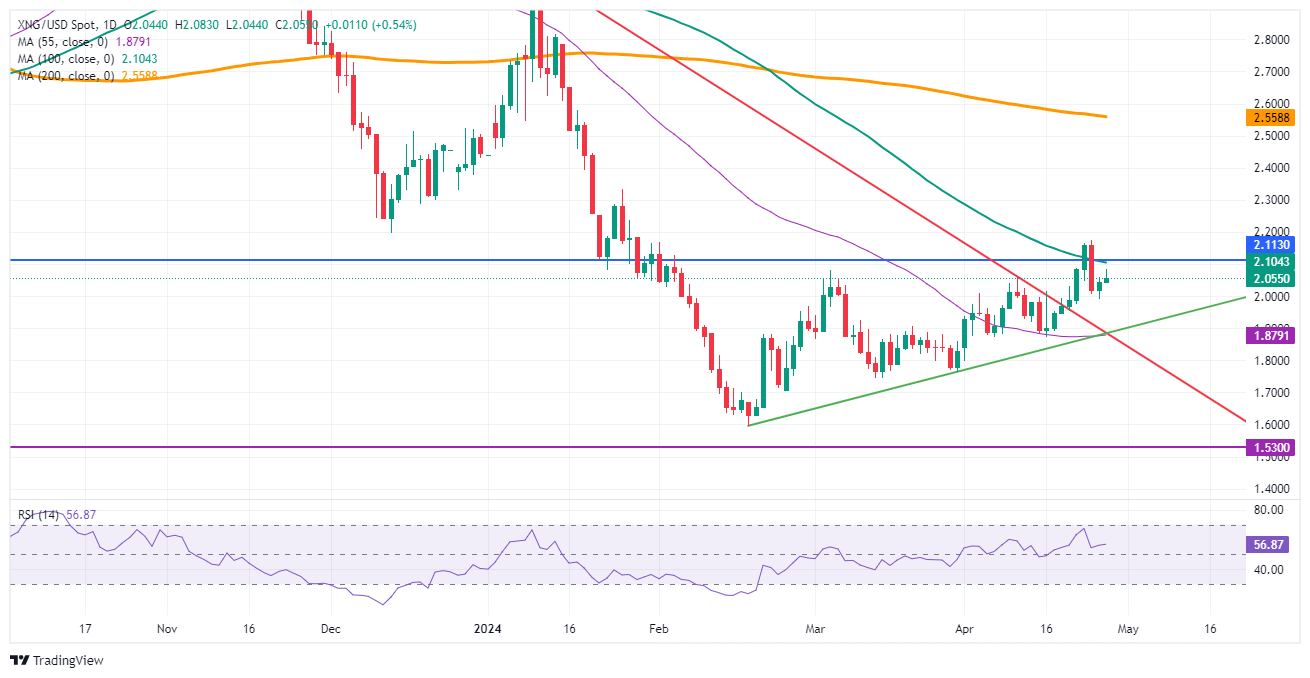
Natural Gas: Daily Chart
Natural Gas FAQs
Supply and demand dynamics are a key factor influencing Natural Gas prices, and are themselves influenced by global economic growth, industrial activity, population growth, production levels, and inventories. The weather impacts Natural Gas prices because more Gas is used during cold winters and hot summers for heating and cooling. Competition from other energy sources impacts prices as consumers may switch to cheaper sources. Geopolitical events are factors as exemplified by the war in Ukraine. Government policies relating to extraction, transportation, and environmental issues also impact prices.
The main economic release influencing Natural Gas prices is the weekly inventory bulletin from the Energy Information Administration (EIA), a US government agency that produces US gas market data. The EIA Gas bulletin usually comes out on Thursday at 14:30 GMT, a day after the EIA publishes its weekly Oil bulletin. Economic data from large consumers of Natural Gas can impact supply and demand, the largest of which include China, Germany and Japan. Natural Gas is primarily priced and traded in US Dollars, thus economic releases impacting the US Dollar are also factors.
The US Dollar is the world’s reserve currency and most commodities, including Natural Gas are priced and traded on international markets in US Dollars. As such, the value of the US Dollar is a factor in the price of Natural Gas, because if the Dollar strengthens it means less Dollars are required to buy the same volume of Gas (the price falls), and vice versa if USD strengthens.
Author

Filip Lagaart
FXStreet
Filip Lagaart is a former sales/trader with over 15 years of financial markets expertise under its belt.


