Ethereum traders show uncertainty, SEC delays decision on Invesco's ETH ETF application
- Ethereum holdings on centralized exchanges continue to decline despite recent whale sales.
- With the SEC delaying its decision on Invesco's spot ETH ETF application, Ethereum ETFs look more unlikely.
- Ethereum could see a decline to key support level before attempting a bounce back to the $3,300 key level.

Ethereum's (ETH) price movement on Monday is leaning toward short traders following investors' uncertainty in the wider crypto market. However, Ethereum in centralized exchanges (CEXs) has been on a steady decline following a delay in Invesco's spot ETH ETF application and Robinhood Crypto receiving a Wells notice from the Securities & Exchange Commission (SEC).
Read more: Ethereum trades above key level, Michael Saylor calls ETH a security
Daily digest market movers: ETH whale sale, declining CEXs holdings, Robinhood Crypto
Ethereum whales could be the determining factor in ETH's move for a potential rally. Here are the top market movers for the number one crypto altcoin:
- In a filing on Monday, the SEC further delayed its decision on the proposed Invesco Galaxy Ethereum ETF. The regulator had previously pushed back the deadline for Invesco's application in February. The new development comes as the SEC has previously delayed decisions on several spot ETH ETF applications, including from BlackRock, Van Eck, Franklin Templeton, and Grayscale.
- A notable Ethereum whale recently withdrew 7,000 ETH from Lido and deposited them on Binance on Monday following Ethereum's recent price drop, according to data from Lookonchain. According to their previous transaction, the whale is in profit of more than $16 million. They withdrew 12,906 ETH at $1,890 from Binance and staked in Lido.
- Despite the recent whale sale, Ethereum on CEXs has been on a steady decline, dropping from 16% in March to 10.66% on May 5, according to data from Glassnode. This indicates increasing investors' confidence in the number one altcoin regardless of recent price drops. For example, a whale who lost $4.63 million from an ETH long position opened another long position again on Sunday, according to data from Lookonchain. He withdrew 6,965 ETH from Binance on Sunday and deposited it into Compound, then borrowed 14.5 million USDT.
- Hong Kong Bitcoin and Ethereum ETFs saw a total trading volume of $7.72 million at the close of the Asian market on Monday. In comparison, the trading volume of Bitcoin ETFs in the United States on the previous trading day was around $1.88 billion - 268x that of Hong Kong ETFs. In an X post, Bloomberg analyst Eric Balchunas commented on the ETFs' trading volume, "Yeah, as we advised, don't expect big numbers in HK vs US." This further strengthens a previous analysis that Hong Kong's ETH ETFs would have minimal effect on Ethereum's price.
Also read: Robinhood gets SEC warning against crypto unit for alleged violation of Securities Act
- The SEC slapped Robinhood Crypto with a Wells notice on May 4, alleging that the exchange violated Section 15(a) and 17A of the Securities Act of 1934. This comes as the May 23 deadline for the SEC to decide on Van Ecks' spot ETH ETF application draws near. With recent actions targeted at Ethereum-related firms and crypto platforms that offer provisions for buying and selling ETH, many have predicted that the SEC will deny applications for spot ETH ETFs.
ETH technical analysis: Ethereum price movement shows investors uncertainty
After moving above the $3,161 key resistance, Ethereum appears to be on a downtrend, shedding about 2.7% of its value on Monday. With the absence of key macro and crypto events in the coming days, traders seem uncertain about the market's direction. However, recent price movements seem to be tilting toward the short direction, as long traders have seen liquidations worth $34.22 million in the past 24 hours.
Read more: Ethereum to break out of bearish move, ETH ETFs unlikely in 2024
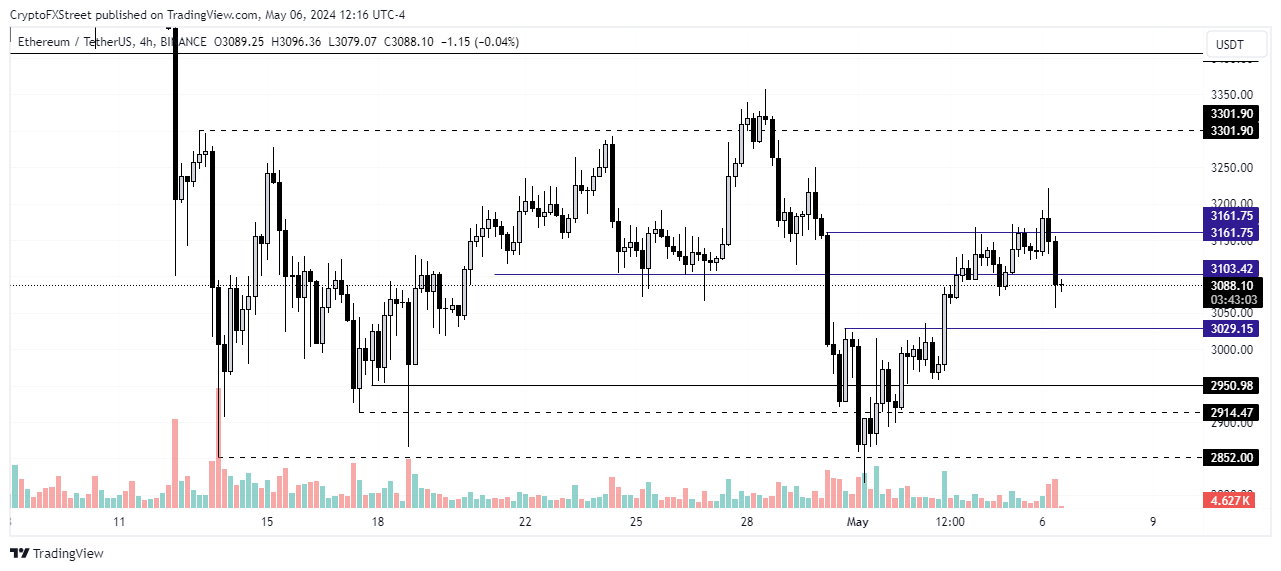
ETH/USDT 4-hour chart
If the decline sustains, ETH may fall close to the $3,029 support level, which may prove a good buying opportunity. A move below the level would indicate a resumption of a bearish trend. However, a move upwards will see ETH attempting to break above the $3,300 key level.
Considering that the level has proven to be strong resistance in the past three weeks — with ETH trading above it only on April 27 and 28 — Ethereum may see a pullback at that level. Hence, it may prove to be a good selling level for traders. The price of BTC could change the dynamics of this prediction as it still largely influences ETH's price movement.
Cryptocurrency metrics FAQs
The developer or creator of each cryptocurrency decides on the total number of tokens that can be minted or issued. Only a certain number of these assets can be minted by mining, staking or other mechanisms. This is defined by the algorithm of the underlying blockchain technology. Since its inception, a total of 19,445,656 BTCs have been mined, which is the circulating supply of Bitcoin. On the other hand, circulating supply can also be decreased via actions such as burning tokens, or mistakenly sending assets to addresses of other incompatible blockchains.
Market capitalization is the result of multiplying the circulating supply of a certain asset by the asset’s current market value. For Bitcoin, the market capitalization at the beginning of August 2023 is above $570 billion, which is the result of the more than 19 million BTC in circulation multiplied by the Bitcoin price around $29,600.
Trading volume refers to the total number of tokens for a specific asset that has been transacted or exchanged between buyers and sellers within set trading hours, for example, 24 hours. It is used to gauge market sentiment, this metric combines all volumes on centralized exchanges and decentralized exchanges. Increasing trading volume often denotes the demand for a certain asset as more people are buying and selling the cryptocurrency.
Funding rates are a concept designed to encourage traders to take positions and ensure perpetual contract prices match spot markets. It defines a mechanism by exchanges to ensure that future prices and index prices periodic payments regularly converge. When the funding rate is positive, the price of the perpetual contract is higher than the mark price. This means traders who are bullish and have opened long positions pay traders who are in short positions. On the other hand, a negative funding rate means perpetual prices are below the mark price, and hence traders with short positions pay traders who have opened long positions.
Author

Michael Ebiekutan
FXStreet
With a deep passion for web3 technology, he's collaborated with industry-leading brands like Mara, ITAK, and FXStreet in delivering groundbreaking reports on web3's transformative potential across diverse sectors. In addition to


