Nasdaq Technicals (NDX QQQ): Playing catch up and setting new record high as big tech bounce continues
- Nasdaq (NDX QQQ) set new record high on Monday.
- The Nasdaq had been lagging the other main indices but now catches up.
- Fed meeting may see a pause until Wednesday is out of the way.

The Nasdaq played a nice game of catch-up on Monday, finally following the lead of the main indices in setting a new record high. The macro-environment remains supportive with ultra-lose fiscal policy, zero rates and a booming economy. The only headwind has been the perceived threat of inflation, but even that has been discounted by markets as yields across the board drop. The US 10-year yield now sits below 1.5%, while the German 10-year yield is back to -0.25%. So nothing to see here then. While the meme stock space remains in crazy overdrive mode with volatility measured in hundreds of percent, the VIX shows relative calm has overtaken the broad market. The VIX has retreated to lows of 16.
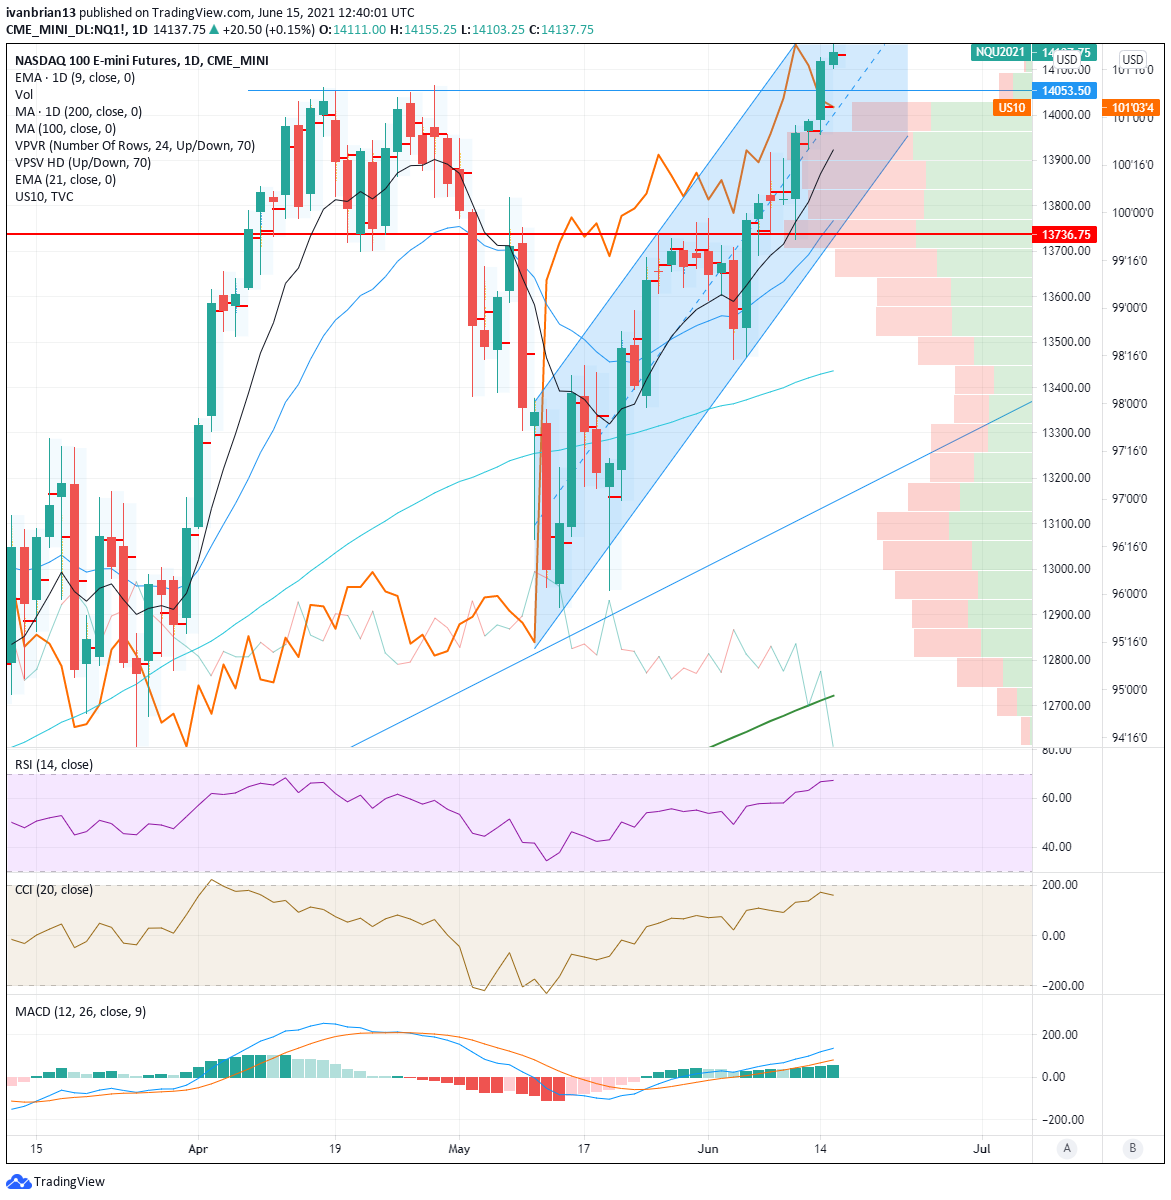
The image shows how the drop in yields (bond prices rising, orange line) gave a nice early signal of the turn in the Nasdaq.
Nasdaq (NDX NQ QQQ) forecast
Let us take a look at the Nasdaq futures chart. Trading the Nasdaq has two main outlets: the futures contract (NQ) or the exchange-traded fund (QQQ). Both will be more or less exact copies of each other, and it is just that the price levels differ.
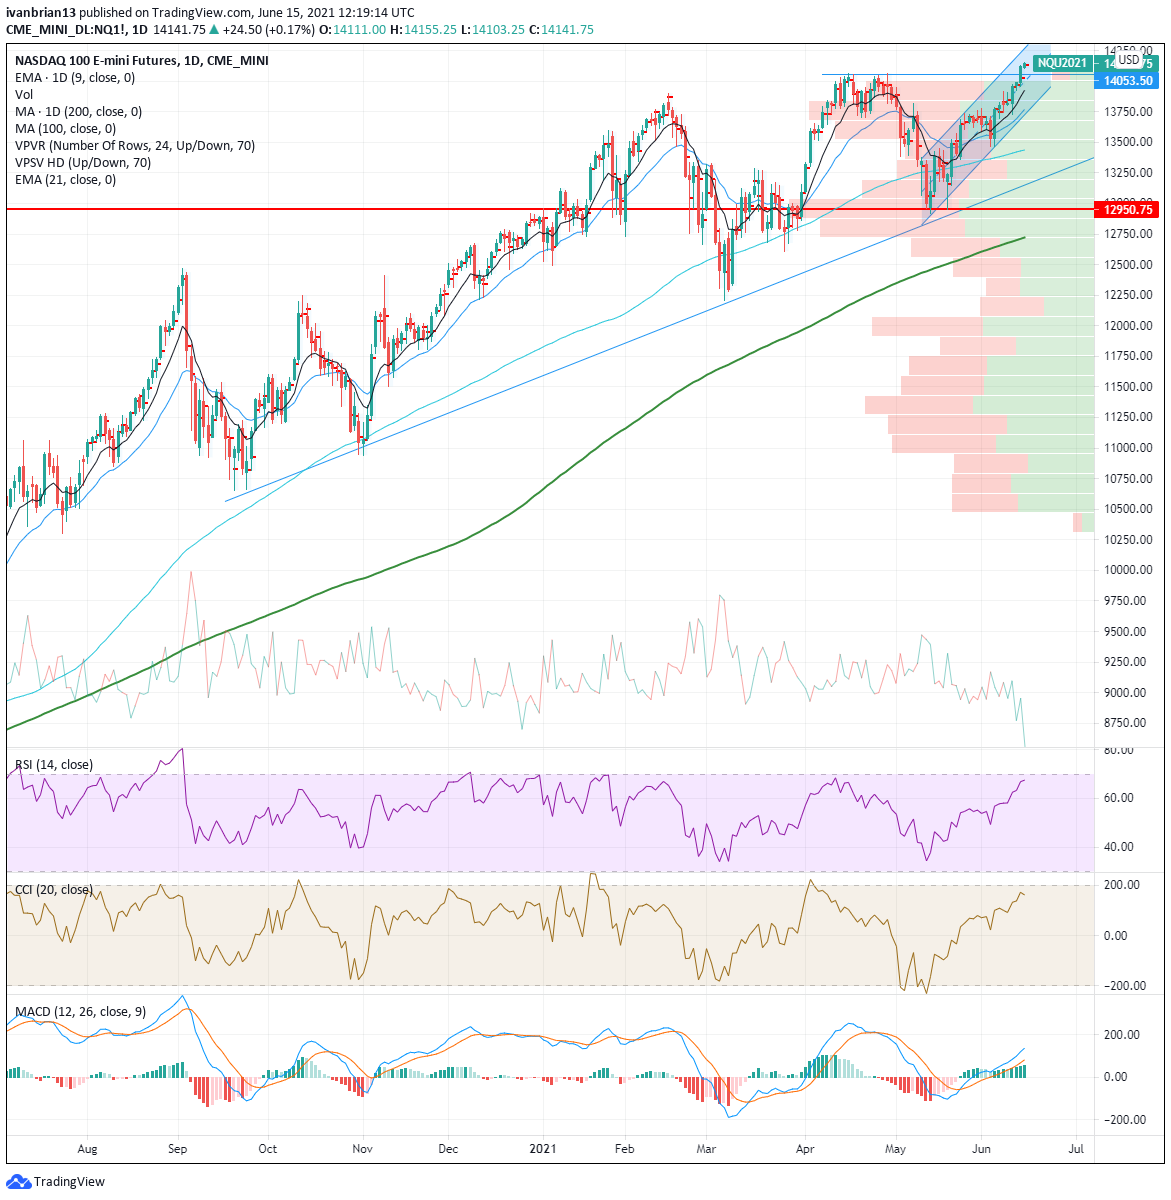
The double bottom from May 13 and 19 was the strong bullish signal that set up the move higher. Trend line support just below added to the strength of this area. The volume-based, point of control since last summer is at 12,950, further strengthening this double bottom support zone. The volume profile on the right of the chart shows the complete lack of volume just below 12,500, so a break would likely have accelerated to the next area of equilibrium. For those not familiar, volume profile is akin to market profile. It shows the price levels with volume profiles for each price point. The red and green within the bars show the buy versus sell volume.
The point of control for a given time period is the area with the highest concentration of volume. It is the fairest price. Within each daily candle, we can see the point of control for that day. This gives us some more information. A higher point of control means more volume toward the high of the day, which is obviously bullish. No indicator is perfect, but this is useful information. A break of 12,500 could have accelerated to 12,000, but this did not play out.
From this double bottom, the RSI and CCI (Relative Strength and Commodity Channel indices) both also trended higher along with price, confirming the trend. Similarly, the MACD (Moving Average Convergence Divergence) indicator matched the move higher and remained crossed into a bullish signal. The 9-day moving average has been holding the trend nicely on the move up, and this would be the first warning sign if broken. The previous high around 14,053 now acts as support as does the 9-day moving average at 13,923. The Nasdaq has been operating in a new up channel from the double bottom, the bottom of this channel gives support at 13,800 and resistance at 14,300. At present, it is all in the hands of the bulls, but the index is likely to see quiet trading until the Fed speaks its mind on Wednesday.
Author

Ivan Brian
FXStreet
Ivan Brian started his career with AIB Bank in corporate finance and then worked for seven years at Baxter. He started as a macro analyst before becoming Head of Research and then CFO.


