- Microvision (MVIS) is the king for retail traders.
- MVIS exhibiting huge volatility and price spikes.
- Microvision shares closed down 24% on Tuesday.
Microvision is a Washington-based technology company making sensors and microdisplays. The primary business is developing laser beam scanning technology. The company has a market cap of $3.2 billion and a high short interest of 20%. Sound familiar?
MVIS stock news
MVIS shares have captured the retail zeitgeist and are in line to dethrone GameStop as the retail tool of choice for speculative volatility. MVIS has been the top trending stock on r/WallStreetBets this week, and with price swings like this, it is easy to see why. MVIS shares are up 274% in 2021. MVIS is up 94% in the last week, 726% in the last 6 months, and wait for it, 7,909% in the last year. Nice if you can buy at the bottom and sell at the top.
All this meets the r/WallStreetBets criteria of highly volatile, highly speculative stocks. Most seasoned investors shy away from such volatility, preferring more sustainable, identifiable businesses. But then older is always more cautious. The new breed of young trader wants volatility, wants action even if that can spell disaster as well as profits. Hey, it is their party.
MVIS has overtaken GameStop on r/WallStreetBets this week with 2,451 mentions against GameStop's 918, according to data from Quiver Quantitative. This is despite GameStop (GME) not exactly going along quietly as it produced some pretty serious price moves also this week.
-637551997205104013.png)
Quiver Quantitative
Just to give some perspective on the hype, this is as per usual not a profitable company. MVIS lost $13.6 million in 2020, $26.4 million in 2019, $27 million in 2018, $25 million in 2017 and $16 million in 2016. The company has been raising cash and diluting existing shareholders as it does so with the share count increasing nearly 50% in the last three years.
So if you choose to invest in this, just know what you are getting into. This is a speculative hype and frenzy for the short term. That is not a problem, since volatility provides opportunity so long as you manage your risk accordingly.
So let us look at the chart from some key levels to help manage risk and trade the volatility.
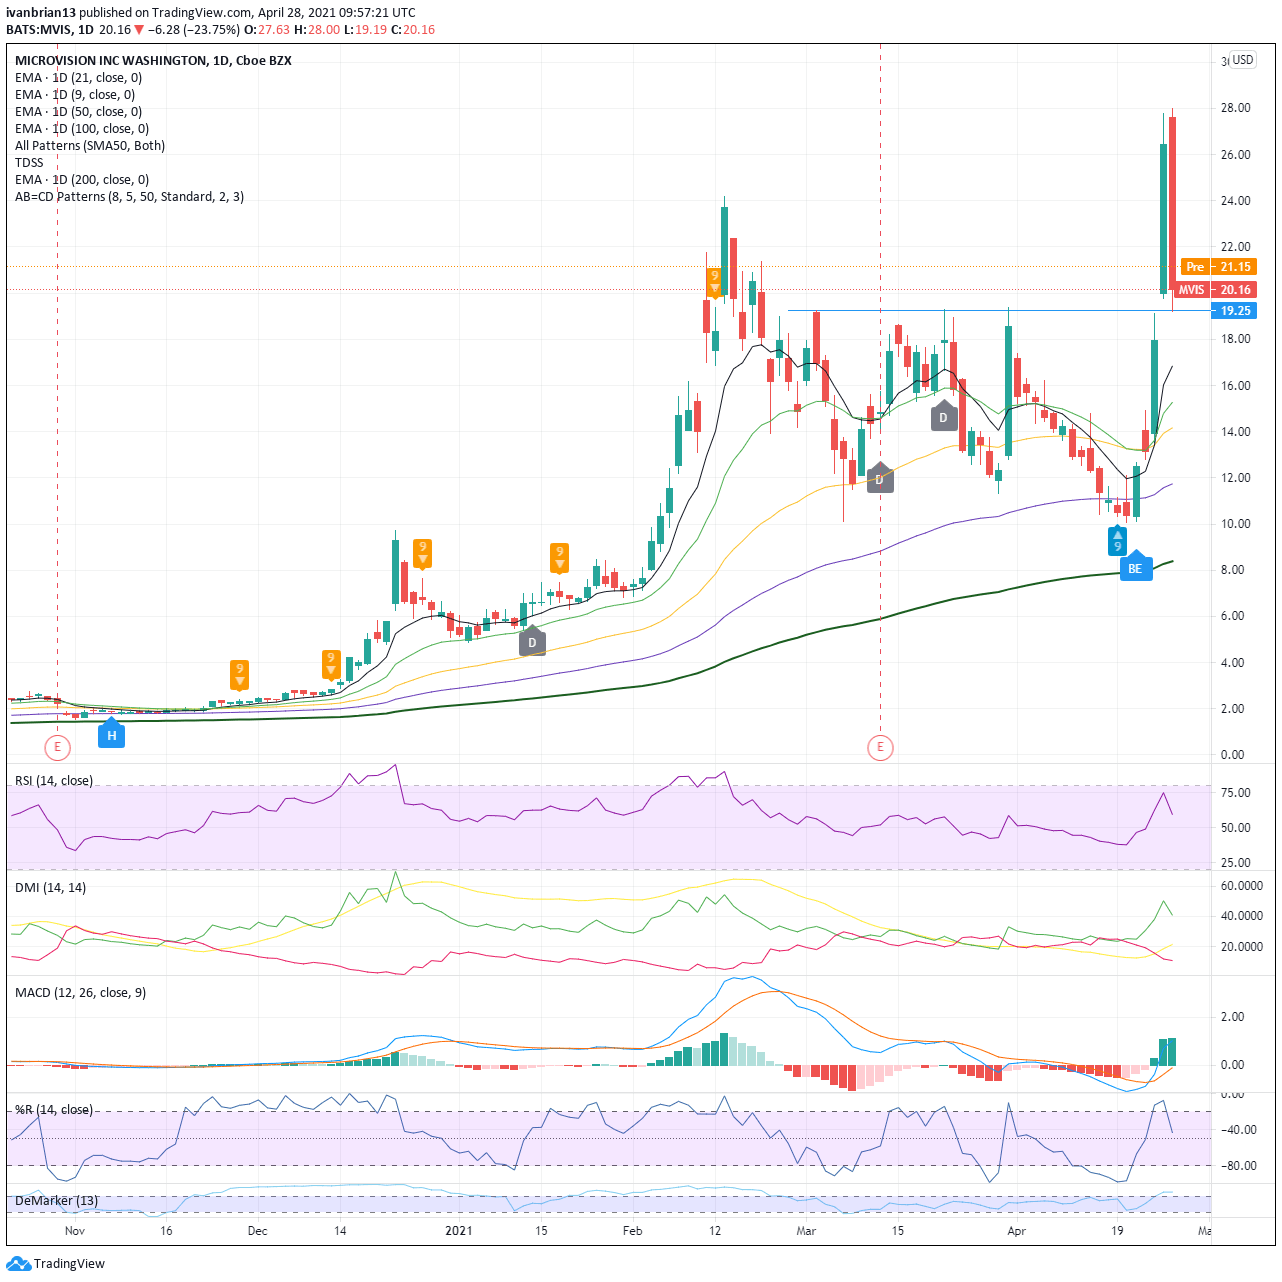
Price is elevated, and so is volatility. The huge breakout has immediately been slammed by an ugly bearish engulfing candle. The Relative Strength Index (RSI) is very close to overbought levels and was above overbought levels on Tuesday. The Williams oscillator is also showing close to overobught levels. The Moving Average Convergence Divergence (MACD) indicator has crossed over into a bullish signal, which had to happen given the price explosion.
$19.25 is a key support as above this MVIS remains bullish. This is where the price has broken out from and gapped up. Tuesday also saw MVIS just about stall on the way back down, bottoming out at $19.19. A break of this will see a quick move to the 9-day moving average support at $16.85 and then the 21-day at $15.28.
The first target to the upside is $28 and then $30.
At the time of writing, the author has no position in any stock mentioned in this article and no business relationship with any company mentioned. The author has not received compensation for writing this article, other than from FXStreet.
This article is for information purposes only. The author and FXStreet are not registered investment advisors and nothing in this article is intended to be investment advice. It is important to perform your own research before making any investment and take independent advice from a registered investment advisor.
FXStreet and the author do not provide personalized recommendations. The author makes no representations as to accuracy, completeness, or the suitability of this information. FXStreet and the author will not be liable for any errors, omissions or any losses, injuries or damages arising from this information and its display or use. The author will not be held responsible for information that is found at the end of links posted on this page.
Errors and omissions excepted.
Information on these pages contains forward-looking statements that involve risks and uncertainties. Markets and instruments profiled on this page are for informational purposes only and should not in any way come across as a recommendation to buy or sell in these assets. You should do your own thorough research before making any investment decisions. FXStreet does not in any way guarantee that this information is free from mistakes, errors, or material misstatements. It also does not guarantee that this information is of a timely nature. Investing in Open Markets involves a great deal of risk, including the loss of all or a portion of your investment, as well as emotional distress. All risks, losses and costs associated with investing, including total loss of principal, are your responsibility. The views and opinions expressed in this article are those of the authors and do not necessarily reflect the official policy or position of FXStreet nor its advertisers. The author will not be held responsible for information that is found at the end of links posted on this page.
If not otherwise explicitly mentioned in the body of the article, at the time of writing, the author has no position in any stock mentioned in this article and no business relationship with any company mentioned. The author has not received compensation for writing this article, other than from FXStreet.
FXStreet and the author do not provide personalized recommendations. The author makes no representations as to the accuracy, completeness, or suitability of this information. FXStreet and the author will not be liable for any errors, omissions or any losses, injuries or damages arising from this information and its display or use. Errors and omissions excepted.
The author and FXStreet are not registered investment advisors and nothing in this article is intended to be investment advice.
Recommended content
Editors’ Picks
EUR/USD eases to near 1.0700 ahead of German inflation data

EUR/USD is paring gains to near 1.0700 in the European session on Monday. The pair stays supported by a softer US Dollar, courtesy of the USD/JPY sell-off and a risk-friendly market environment. Germany's inflation data is next in focus.
USD/JPY recovers after testing 154.50 on likely Japanese intervention

USD/JPY is recovering ground after sliding to 154.50 on what seemed like a Japanese FX intervention. The Yen tumbled in early trades amid news that Japan's PM lost 3 key seats in the by-election. Focus shifts to the US employment data and the Fed decision later this week.
Gold price holds steady above $2,335, bulls seem reluctant amid reduced Fed rate cut bets

Gold price (XAU/USD) attracts some buyers near the $2,320 area and turns positive for the third successive day on Monday, albeit the intraday uptick lacks bullish conviction.
Ripple CTO shares take on ETHgate controversy, XRP holders await SEC opposition brief filing

Ripple loses all gains from the past seven days, trading at $0.50 early on Monday. XRP holders have their eyes peeled for the Securities and Exchange Commission filing of opposition brief to Ripple’s motion to strike expert testimony.
Week ahead: FOMC and jobs data in sight

May kicks off with the Federal Open Market Committee meeting and will be one to watch, scheduled to make the airwaves on Wednesday. It’s pretty much a sealed deal for a no-change decision at this week’s meeting.