MULN stock continues its collapse as it closes 14% lower on Monday
- MULN stock closes at $1.84 on Monday, losing over 14%.
- Mullen Automotive announces plans to start battery production at California plant.
- MULN stock still has retail believers, but Hindenburg has dented confidence.

Mullen Automotive (MULN) stock continued its collapse on Monday with the former retail favourite closing below $2 at $1.84. The stock has been under continued pressure since Hindenburg Research issued a strongly negative report several weeks ago that dented a lot of confidence in the name. The report raised some serious questions that have yet to be fully clarified. Despite some occasional bounces, it has mostly been a strong downtrend for MULN stock since the report was first issued.
See latest news on Tesla and Twitter here
MULN Stock News
Monday had actually begun on a positive note for Mullen when the company announced it was to commence battery pack production at its plant in Monrovia, California. MULN stock surged in Monday's premarket, and the shares traded up 20% at $2.67 as retail investors appeared to chase the stock higher on what sounded like positive news. However, it was not long before reality set in as there are still too many question marks surrounding the business plan. MULN stock sold off sharply and by the open of the regular session was in negative territory. This carried on and resulted in a near 15% loss for the day. Mullen filed a prospectus Form 424B4 on Friday for the sale of up to 253,109,032 shares.
"This prospectus of Mullen Automotive Inc. (formerly known as Net Element, Inc.), a Delaware corporation (the “Company” or “Mullen”), relates solely to the resale by the investors listed in the section of this prospectus entitled “Selling Stockholders” (the “Selling Stockholders”) of up to 253,109,032 shares (“Offered Shares”) of our common stock, par value $0.001 per share (“Common Stock”)," the filing says.
That naturally will not have helped the MULN stock price and was a large part of the cause for the steep fall.
MULN Stock Forecast
MULN stock has now broken the support line at $2.06, which was the breakout point of the last spike on March 17. We now have a weakening Relative Strength Index (RSI), Money Flow Index (MFI) and a bearish crossover from the Moving Average Convergence Divergence (MACD). In addition, sentiment is gradually weakening and news is not helping. FXStreet forecasts a further decline to below $1 based on this price action. At least at $1 there is huge volume profile support, which may help, but our overall view remains bearish.
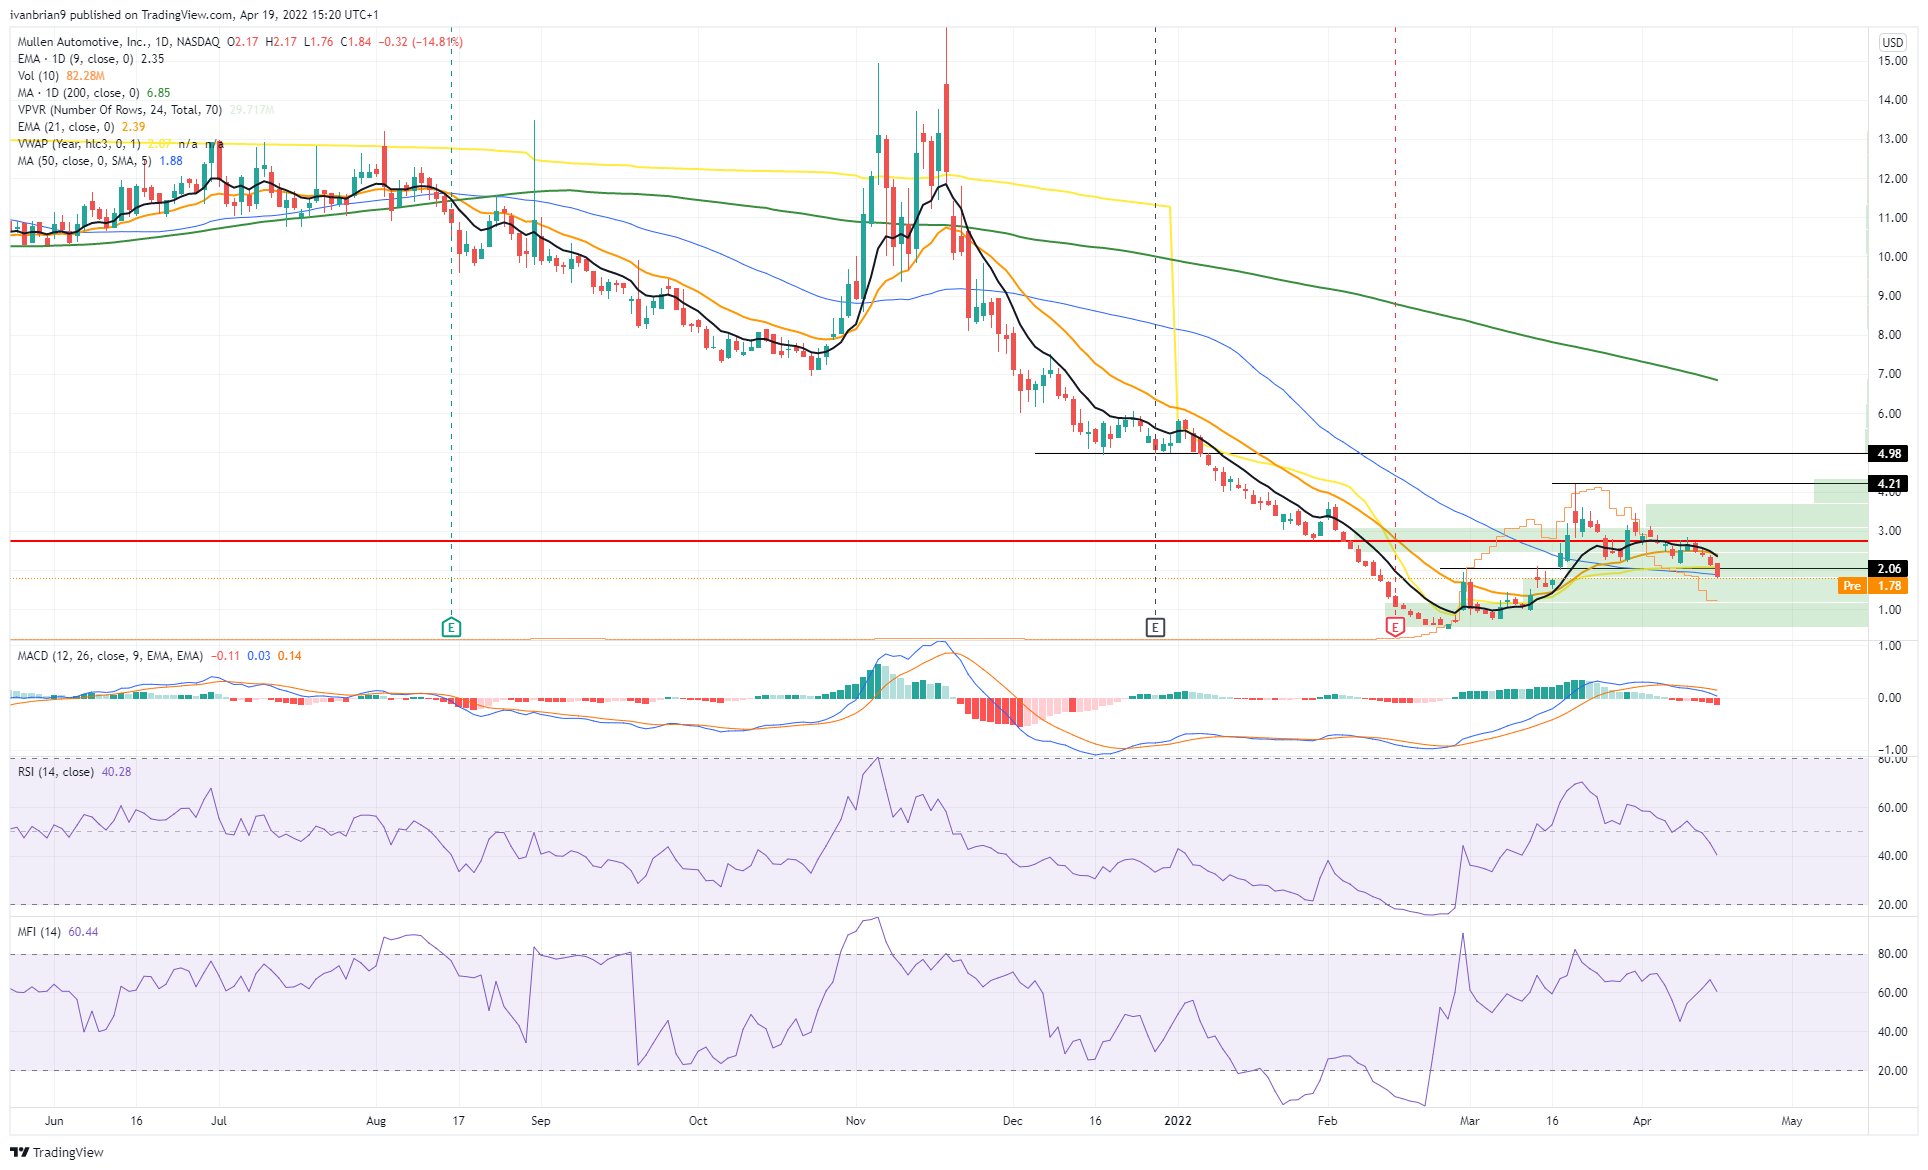
MULN stock chart, daily
Author

Ivan Brian
FXStreet
Ivan Brian started his career with AIB Bank in corporate finance and then worked for seven years at Baxter. He started as a macro analyst before becoming Head of Research and then CFO.


