Mexican Peso continues weakening as multiple risks weigh
- The Mexican Peso extends its weakness into a fourth day as multiple risks lead traders to press “sell”.
- Trump Tariff threats, a critical IMF report, political risks and weak data all combine to weigh on the Mexican currency.
- USD/MXN extends its rally from the base of a major rising channel as technical indicators point north.

The Mexican Peso (MXN) seems to be rinsing and repeating the depreciation of the past few days on Thursday as market bears – now more confident in the persistence of the evolving downtrend – push the Peso lower in all its key pairs.
A cocktail of ingredients is contributing to the Peso’s shakedown, including former president Donald Trump’s threat to slam Mexican auto imports with tariffs of up to 300%, an International Monetary Fund (IMF) report that highlighted a slowdown in economic activity; political risk, and a deterioration of Consumer Confidence data for September.
The release of higher-than-expected US Retail Sales data, moreover, is injecting fresh energy into USD/MXN's rally as it pushes up towards the key psychological 20.00 barrier.
Mexican Peso cracks as Donald thumps imports piñata
The Mexican Peso declined on average 1.5% on Tuesday, after Donald Trump said in an interview with Bloomberg News that “Mexico is a tremendous challenge for us.” He went on to explain how China was building mega car-manufacturing plants on the US-Mexico border, from where it was flooding the US market and hounding out US competitors.
Trump vowed to stop the practice by reinstating high tariffs and so enable a regeneration of the US auto industry. Given the significance of the automotive industry to the Mexican economy, as well as the demand for Peso’s generated by exports to the US, the former president’s comments weighed on MXN..
Mexican Peso undermined by IMF report
The Mexican Peso saw further weakness after the IMF published a report on Tuesday in which it forecast Gross Domestic Product (GDP) growth slowing to 1.5% at the end of 2024. This comes after the most recent GDP data showed the economy grew 2.1% in Q2. It is also below the Bank of Mexico’s own 2.1% forecast for 2024, although it is slightly higher than the average of the responses in the Banxico’s September survey of private-sector analysts of 1.45%.
The main reasons for the slowdown were given as “binding capacity constraints and a tight monetary policy stance” as well as weaker-than-expected growth in the US and the “unforeseen effects from recent institutional reforms”, according to the report. The latter refers to the controversial judicial reform, which has spooked markets.
In regards to headline inflation, the IMF saw this falling to the Bank of Mexico’s (Banxico) 3.0% target in 2025, in line with the central bank’s own forecasts but below the Banxico survey average forecast of 3.86% (3.80% median).
Banxico set to cut and cut rates again before year-end
Further downwards pressure on the Peso comes from expectations of lower interest rates, which reduce foreign capital inflows. The central bank is expected to cut the prime interest rate by 50 basis points (bps) (0.50%) before the end of 2024, bringing it down to 10.00% from 10.50%.
This is reflected in Banxico’s survey mean forecasts, which show respondents project a fall in the bank rate to an average of 10.04% by the end of 2024 (10.00% median) and 8.09% by the end of 2025 (8.00% median).
Technical Analysis: USD/MXN extends recovery from base of rising channel
USD/MXN extends its recovery from support provided by the base of a rising channel as well as the (red) 50-day Simple Moving Average (SMA) nearby.
USD/MXN Daily Chart
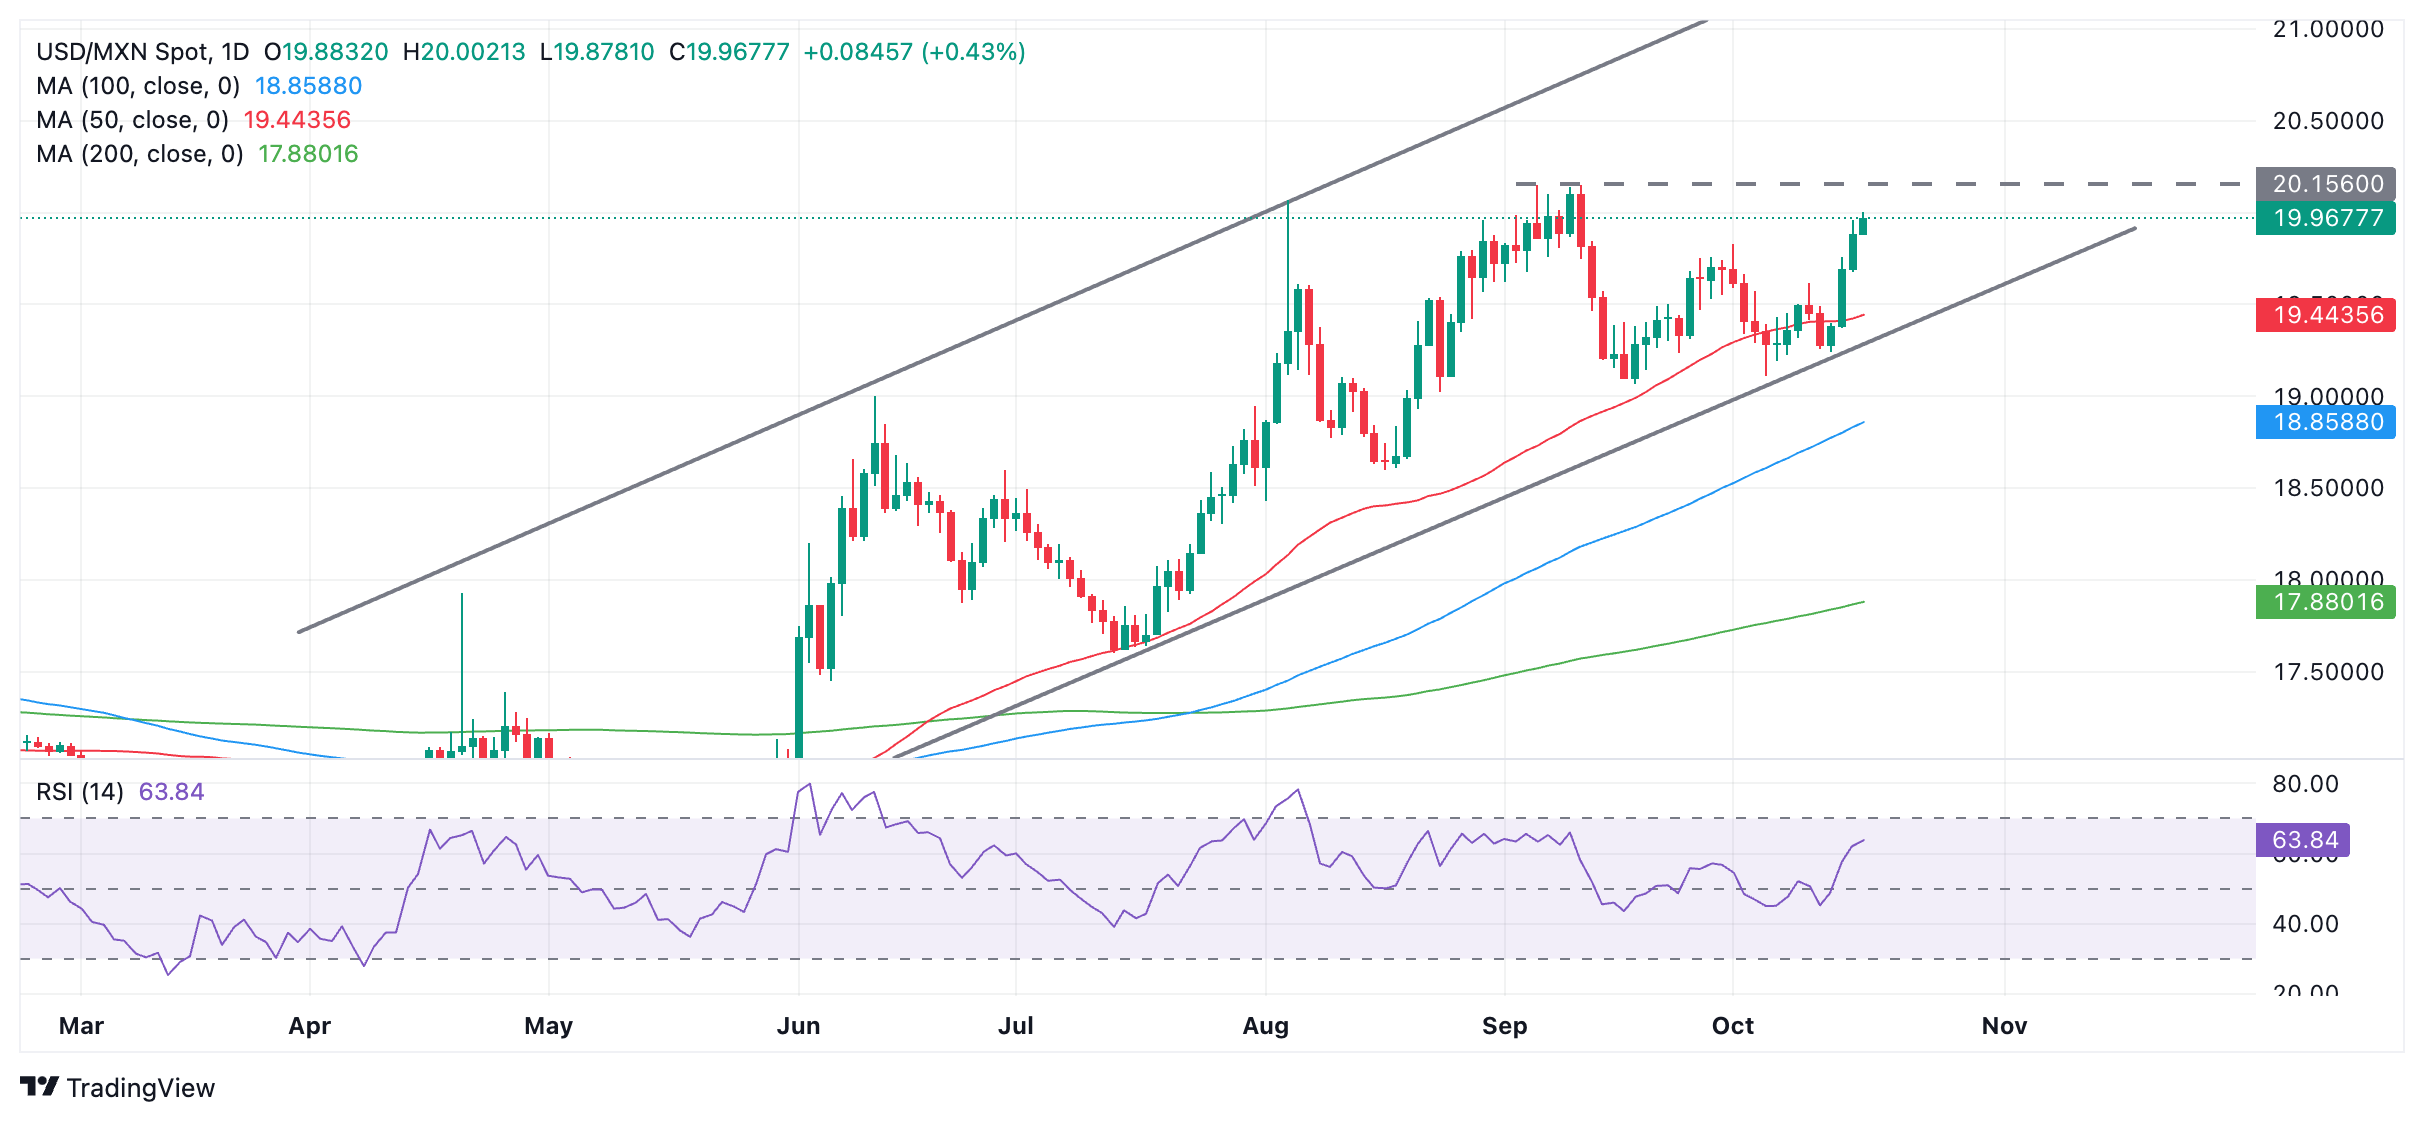
USD/MXN is now probably in a short-term uptrend, which given the technical analysis principle that “the trend is your friend,” is biased to continue.
The break above the 19.83 (October 1 high) target will now probably lead to a move up to between 20.10-20.15 and the vicinity of the September 10 high at 20.13.
The Moving Average Convergence Divergence (MACD) (blue) line is rising sharply and has broken above its (red) signal line, further indicating a bullish bias.
Economic Indicator
Retail Sales (MoM)
The Retail Sales data, released by the US Census Bureau on a monthly basis, measures the value in total receipts of retail and food stores in the United States. Monthly percent changes reflect the rate of changes in such sales. A stratified random sampling method is used to select approximately 4,800 retail and food services firms whose sales are then weighted and benchmarked to represent the complete universe of over three million retail and food services firms across the country. The data is adjusted for seasonal variations as well as holiday and trading-day differences, but not for price changes. Retail Sales data is widely followed as an indicator of consumer spending, which is a major driver of the US economy. Generally, a high reading is seen as bullish for the US Dollar (USD), while a low reading is seen as bearish.
Read more.Last release: Thu Oct 17, 2024 12:30
Frequency: Monthly
Actual: 0.4%
Consensus: 0.3%
Previous: 0.1%
Source: US Census Bureau
Retail Sales data published by the US Census Bureau is a leading indicator that gives important information about consumer spending, which has a significant impact on the GDP. Although strong sales figures are likely to boost the USD, external factors, such as weather conditions, could distort the data and paint a misleading picture. In addition to the headline data, changes in the Retail Sales Control Group could trigger a market reaction as it is used to prepare the estimates of Personal Consumption Expenditures for most goods.
Author

Joaquin Monfort
FXStreet
Joaquin Monfort is a financial writer and analyst with over 10 years experience writing about financial markets and alt data. He holds a degree in Anthropology from London University and a Diploma in Technical analysis.


