|

META: Wave (iv) finds buyers within blue box area

In this article we will analyze our forecast for META in the short term cycle. Since the short term peak of META from 05.22.2023 to end wave (iii) we have been expecting a pullback within wave (iv) to take place. Here at Elliott Wave Forecast we have in place a system that allows us to measure an area in which we can expect a react to take place.

We call it equal legs area or blue box area as you might have seen within our charts. These areas provide us with at least an 85% chance of a minimum of 3 waves bounce or reaction to take place. We can use these areas to enter in the market with a defined entry, Stop Loss and exit strategy.

We teach how to use our system within our member’s area and live trading room. Once a member or in trial you will be able to gather more of that information under your disposal. Nevertheless, let’s have a look now on the 45 mins chart of META as provided to members from 05.24.2023. We have been expecting little more downside to reach the blue box area before turning higher.

META 45 min chart pre market update 05.24.2023
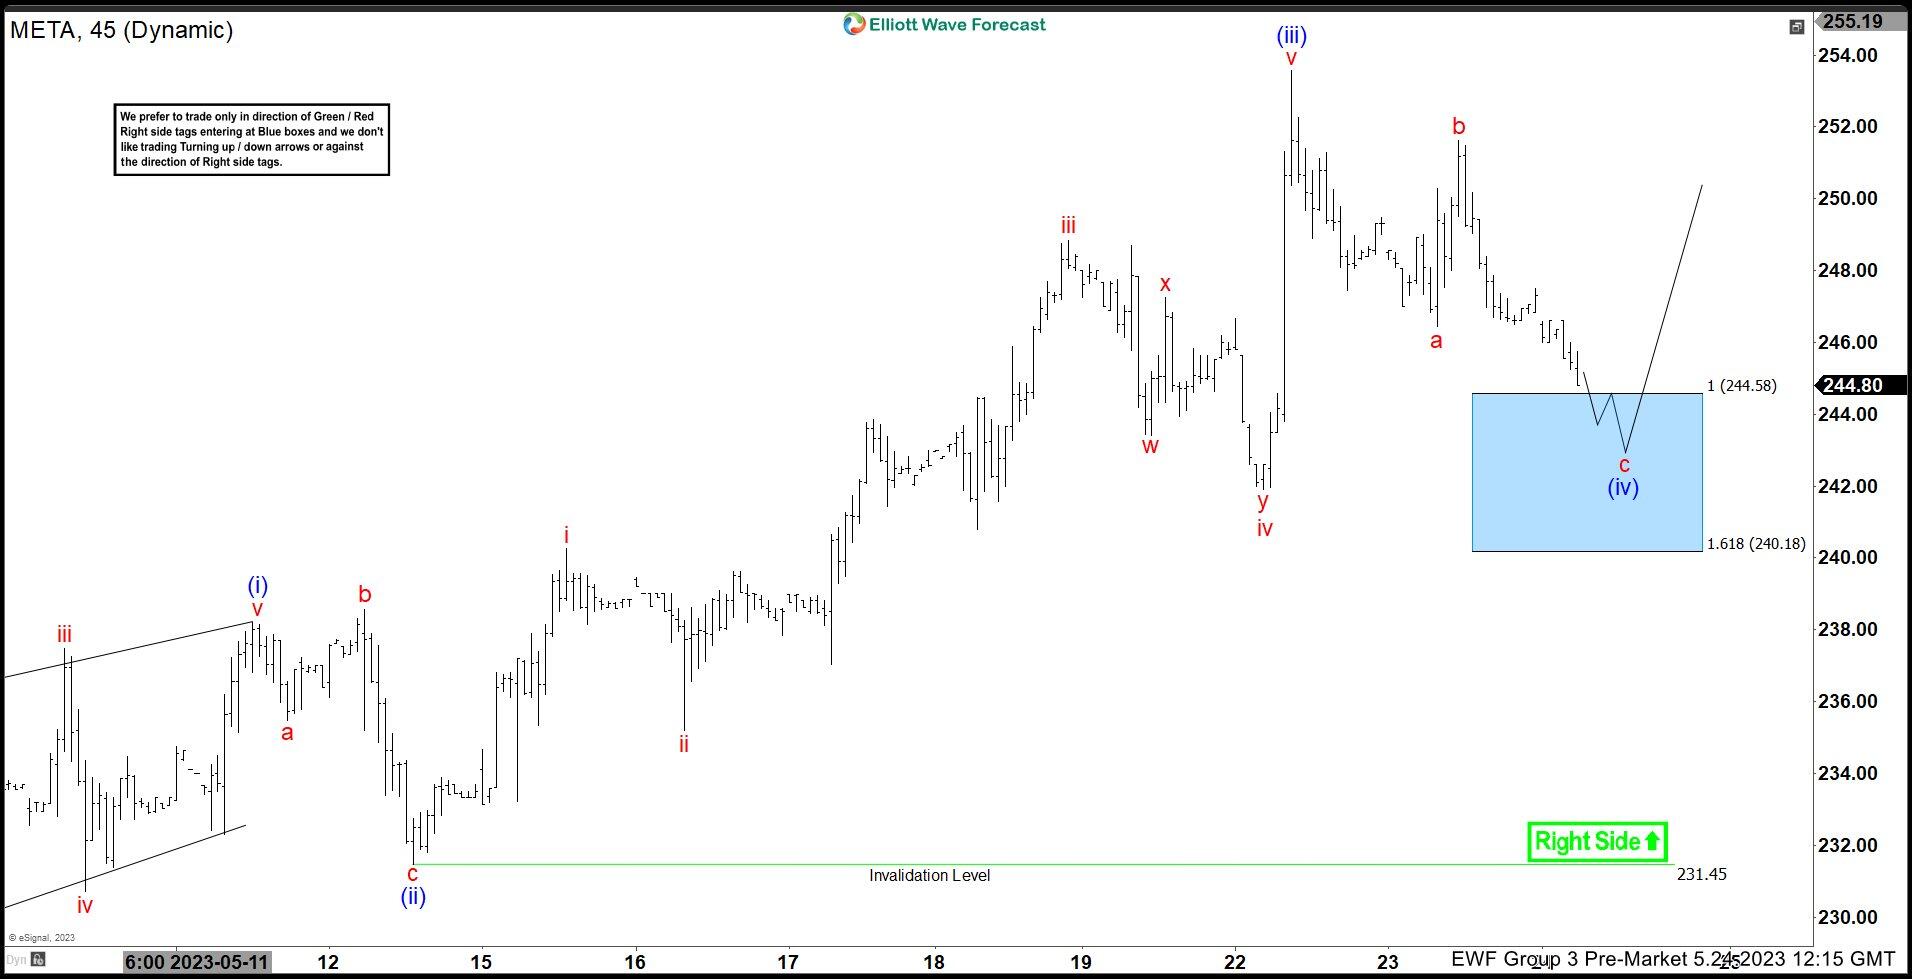
As we can see the market was marginally above within blue box area of 244.58 – 240.18 and we have been expecting a dip to reach the area. We recommend members to always buy from the 100% extension area with a stop loss just below the 1.618 area. Fast forward, towards the latest post market update now from 05.26.2023, we will see that the market has already reacted higher and what we expect next.

A very clear reaction higher took place from 244.56 inside the blue box area. The reaction higher within wave iii of (v) of ((v)). Expecting one more high in v to end (v) of ((v)) to end wave 3 in red, before a pullback in 4. You can learn more once become a member at Elliott Wave Forecast. Join us to learn the next trading opportunities in META and other Stocks or ETFs. Belongs to our Group 3 of instruments.

Author

Elliott Wave Forecast Team

Elliott Wave Forecast Team

ElliottWave-Forecast.com

More from Elliott Wave Forecast Team
Share:

Editor's Picks

AUD/USD remains depressed near 0.6950 after RBA minutes

AUD/USD attracts follow-through selling during Tuesday’s Asian session, looking to extend the overnight rejection slide from 0.7000, or a two-week top, following the release of RBA meeting Minutes. The US Dollar retains a bullish undertone near its highest level since April 2025 as energy-driven inflation risks keep December Fed rate hike bets firmly on the table. Adding to this, geopolitical risks further underpin the safe-haven USD.

USD/JPY extends retreat below 158.50 as intervention risks loom

USD/JPY is dropping below 158.50 in the Asian session on Tuesday, snapping a two-day winning streak and pulling back from an over two-week top touched the previous day, despite Japan's soft PPI inflation print. Bulls turn cautious amid speculation that authorities will step in to prop up the Japanese Yen, which, in turn, weighs on the pair.

Gold advances to $4,200 amid retreating USD; Fed hike bets to cap further gains

Gold builds on its modest intraday move up and hits a fresh daily high around the $4,200 neighborhood during the Asian session. The US Dollar retreats from its highest level since April 2025 amid some profit-taking, offering support to the commodity. However, the US Federal Reserve's hawkish stance and escalating Middle East conflicts could limit deeper losses for the safe-haven buck.

Cardano: Retail support wanes as ADA tests a make-or-break level

Cardano price is up nearly 2% at press time on Tuesday, holding above its 50-day Exponential Moving Average (EMA) at $0.2302 and a near-term rising support trendline at $0.2264. ADA is losing retail demand in the derivatives market as its futures Open Interest declines and funding rates flip negative.

Indian Rupee gains further on RBI’s fresh measures to lower US Dollar’s demand

The Indian Rupee extends the Monday’s advance against the US Dollar on Tuesday, driven by the announcement of fresh Reserve Bank of India’s US Dollar-related measures to shore up the domestic currency. In the opening session, the USD/INR pair tumbles 0.6% to near 95.00, the lowest level seen in over a month.

Has Bitcoin really escaped the macro forces it was built to fight?
Over 17 years ago, Satoshi Nakamoto designed Bitcoin (BTC) on the back of a global financial crisis as an alternative to the global monetary system outside the control of central banks, governments and traditional intermediaries. This raises a key question: has Bitcoin really become independent of the macroeconomic forces it was built to challenge?